The combination of several resistances turned out to be a too big challenge for the buyers at the end of the previous week, which resulted in a decline in the greenback on the following days. Does it mean that another profitable opportunity may be just around the corner?
EUR/USD and Bullish Formation

On Friday, we wrote the following:
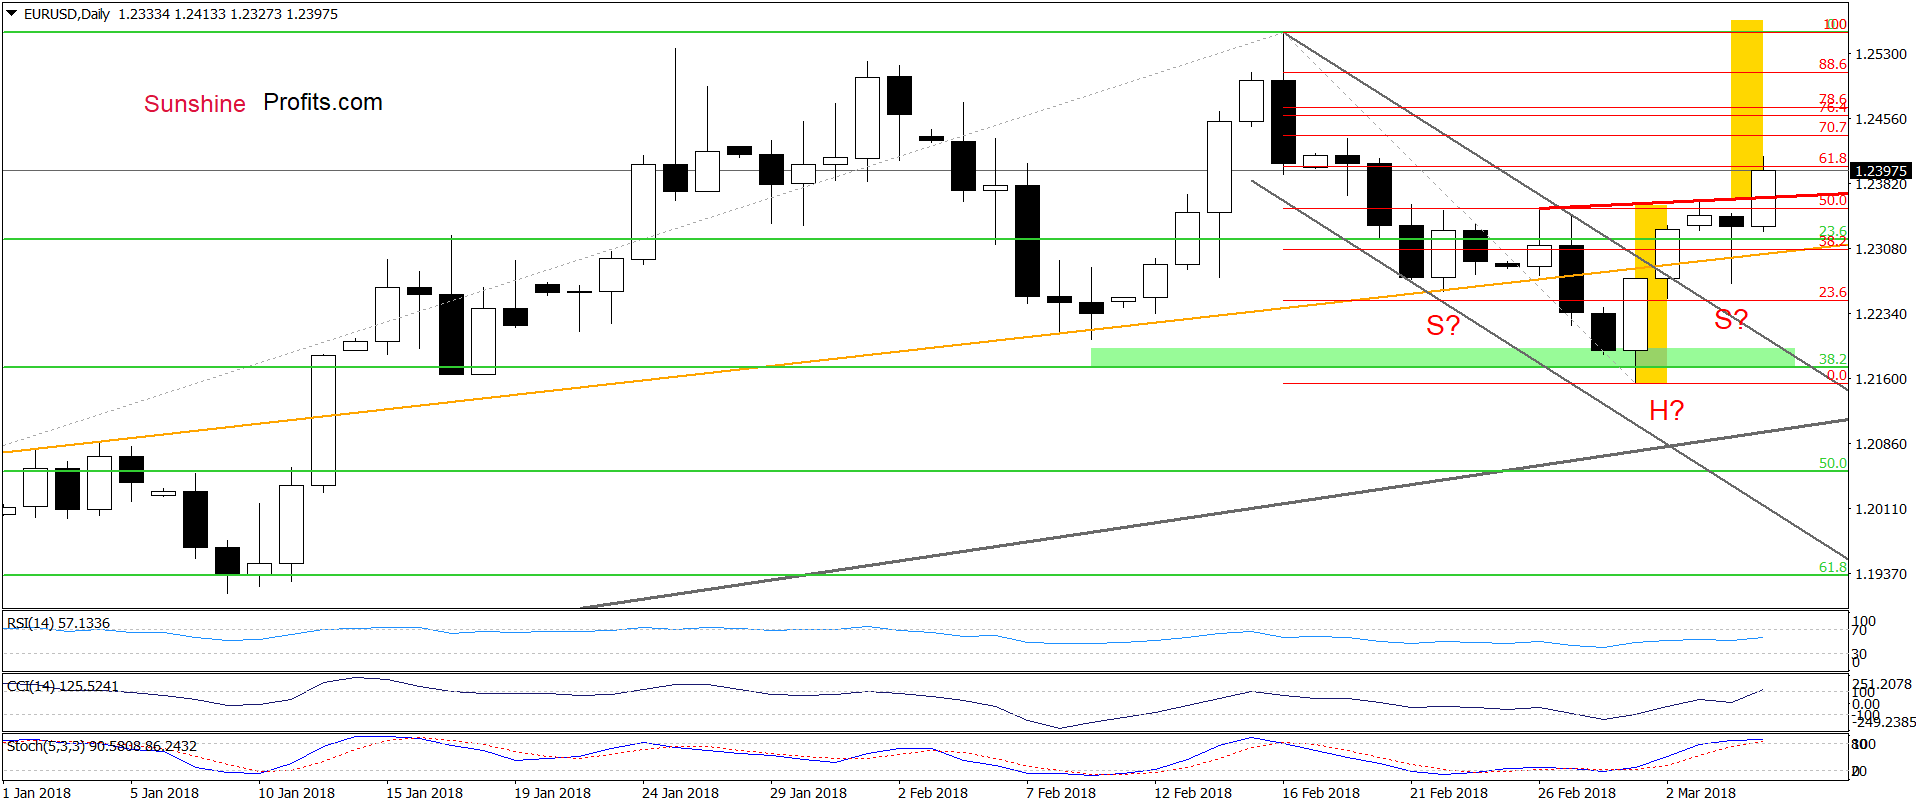
The first thing that catches the eye on the above chart is an invalidation of the tiny breakdown under the 38.2% Fibonacci retracement and the green zone. Yesterday’s white candlestick showed currency bulls’ strength, which resulted in two more improvements earlier today: a comeback above the orange resistance line (one more invalidation of the earlier breakdown) and a breakout above the upper border of the grey declining trend channel.
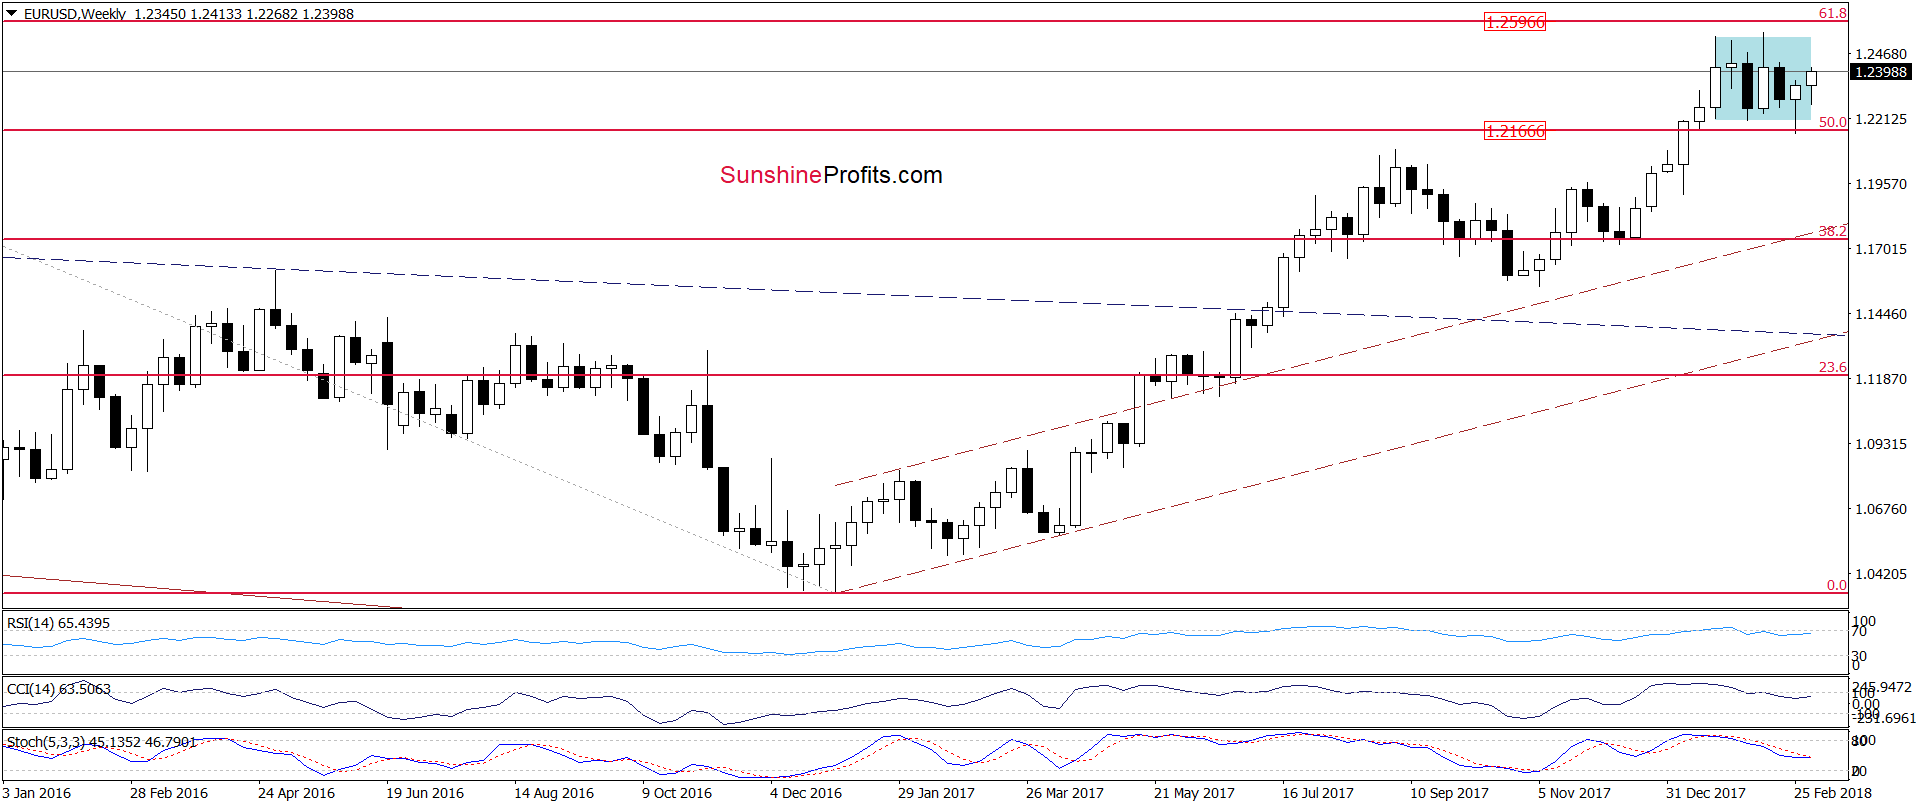
Additionally, the CCI and the Stochastic Oscillator generated buy signals, increasing the likelihood of further improvement in the coming days. On top of that, thanks to this rebound EUR/USD invalidated the earlier breakdown under the lower border of the blue consolidation (marked on the weekly chart below), giving currency bulls another reason to act.
Looking at the above charts, we see that the situation developed in line with the above scenario and EUR/USD extended gains earlier today. Thanks to today’s increase the pair broke above the red rising resistance line, which means that the reverse head and shoulders formation is underway. At this point, it is also worth noting that if we see a daily closure above this line (in this case, we’ll consider opening long positions), the bulls may even take the pair to the 2018 peak.
GBP/USD on Way to 1.4000
Quoting our last commentary on this currency pair:
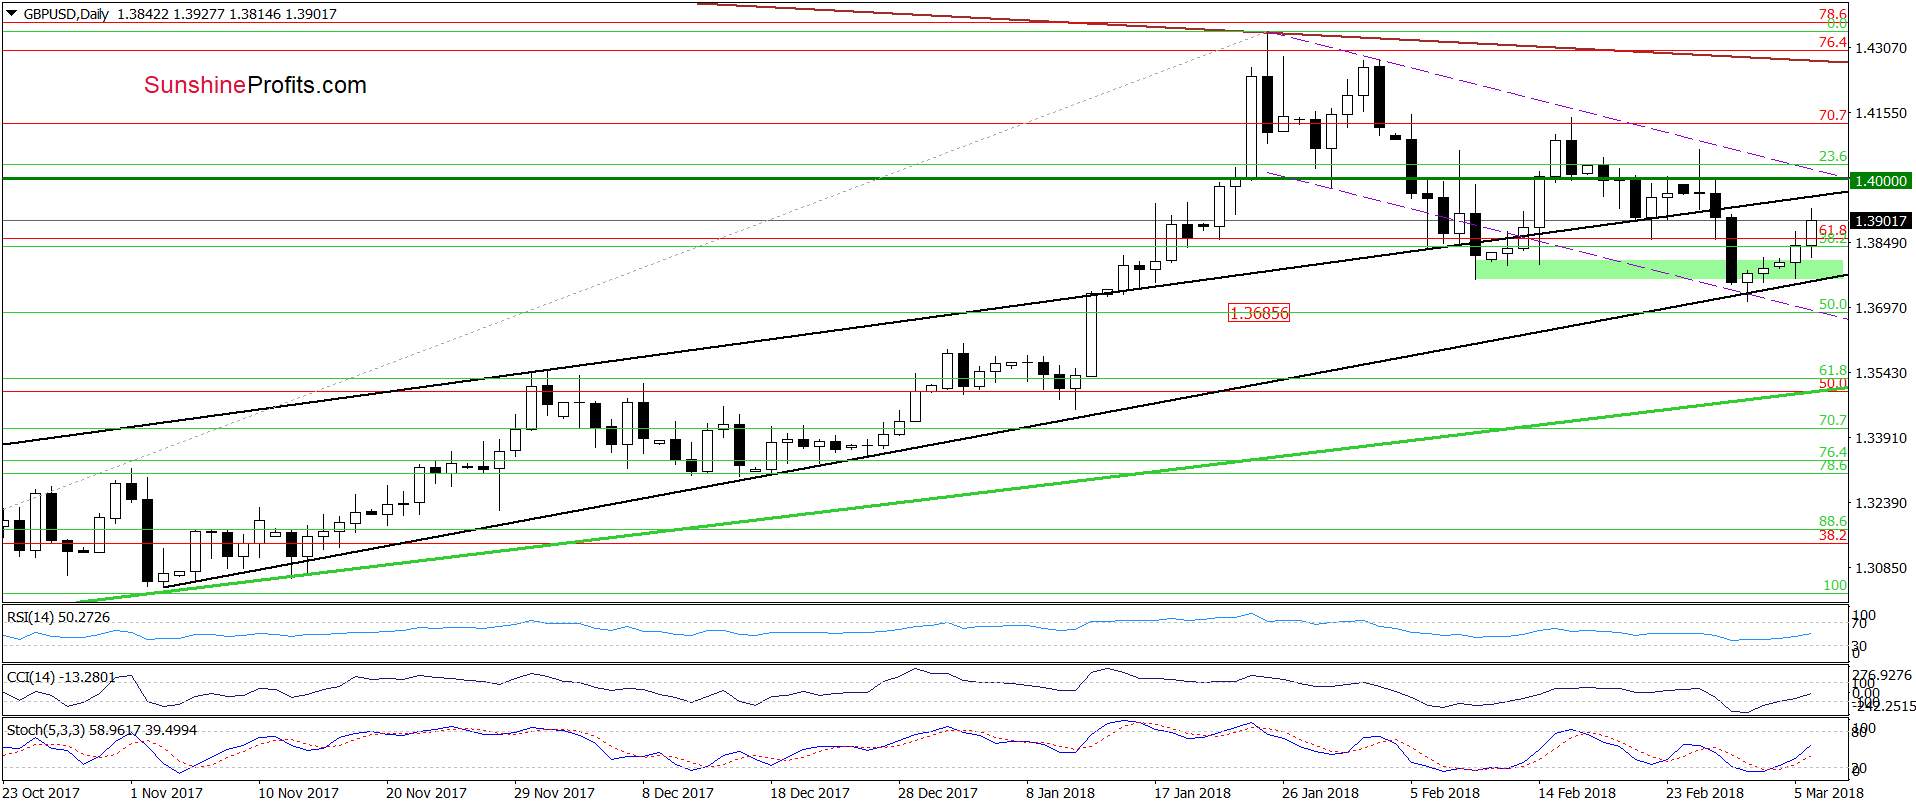
(…) the pair also slipped to the lower border of the purple declining very short-term chart, which increases the probability of rebound in the coming days – especially when we factor in the current position of the daily indicators (they are very close to generating buy signals).
If we see (…) further improvement (…), the exchange rate will likely come back to the upper black line (the upper line of the rising wedge, which is currently at 1.3932).
From today’s point of view, we see that although GBP/USD stuck in the green support zone for a moment, it was just the calm before the storm. As you see, currency bulls gathered enough strength to push the pair higher, which suggests that we’ll see a realization of the Friday’s scenario in a near future. This means that our decision to close short positions and take profits off the table was taken at a very good moment.
Finishing today’s commentary on the cable please note that the buy signals generated by the indicators remain in the cards, suggesting that further improvement and a test of the upper border of the purple declining trend channel (marked with dashed lines) can’t be ruled out. If currency bulls show more strength and break above this resistance, we’ll consider opening long positions.
AUD/USD vs. First resistance Area
In our Friday’s alert, we wrote:
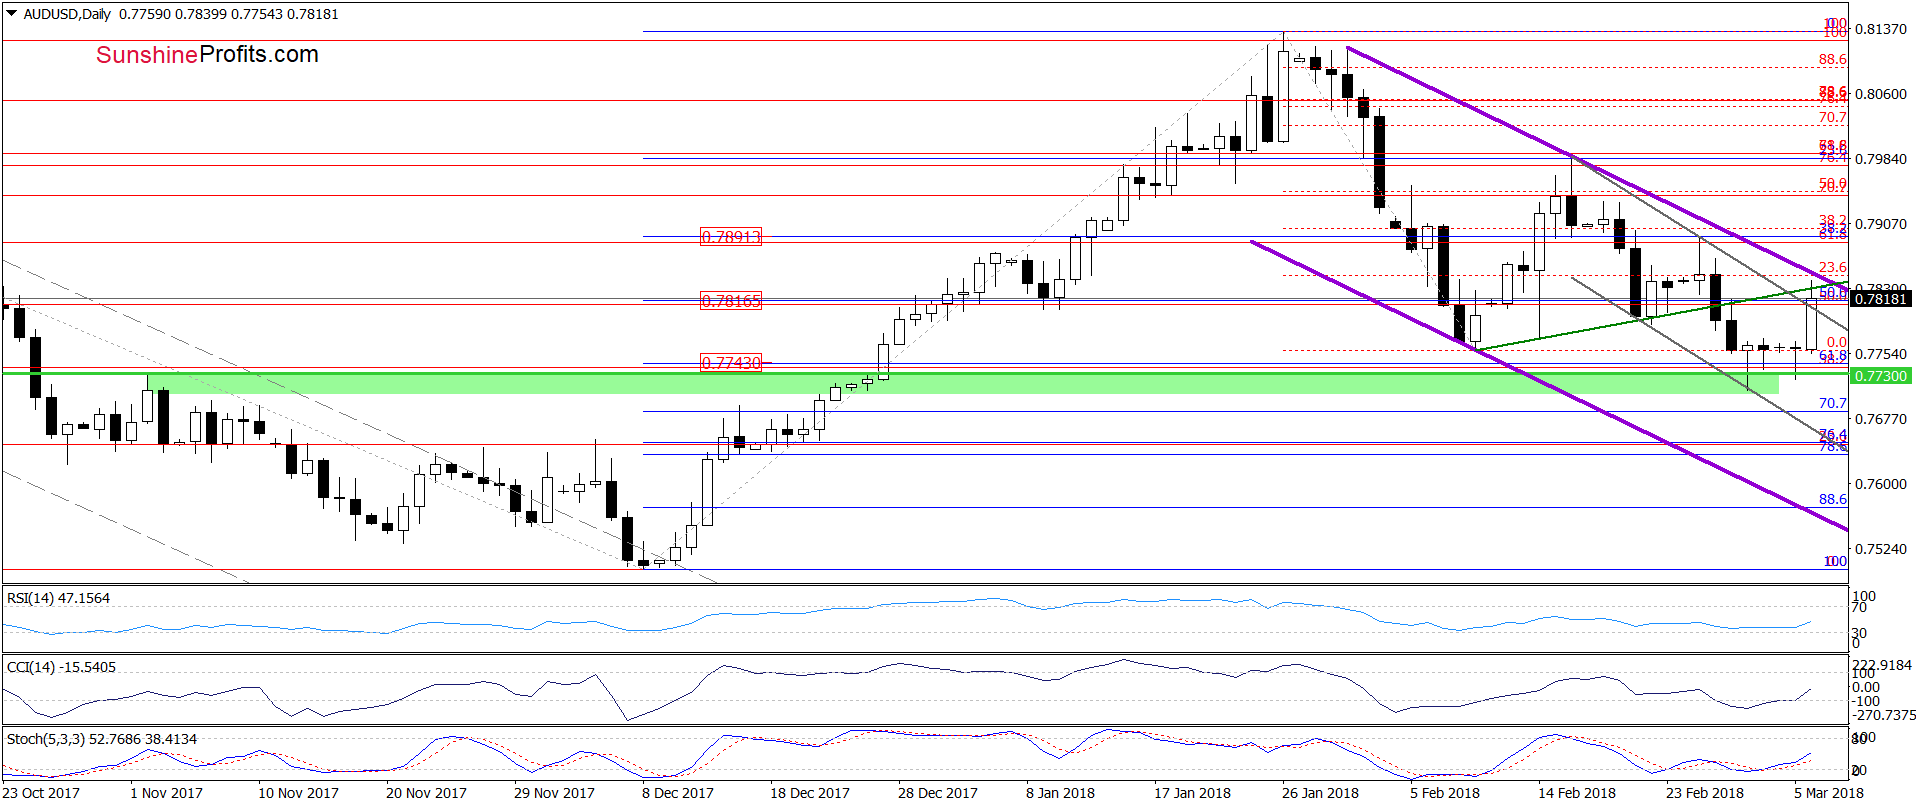
(…) the green support zone (…) together with the lower border of the very short-term grey declining trend channel and the position of the daily indicators (…) encouraged the buyers to act, which triggered a rebound.
Although the pair erased some of yesterday’s gains earlier today, it seems to us that the current situation in the USD Index and both the above-mentioned currency pairs will translate into further improvement in the coming days.
If AUD/USD turns north, the pair will test the strength of the previously-broken green line based on the February lows and the upper border of the grey declining trend channel, which together serve as the nearest resistance.
As you see on the daily chart, although in the case of this currency pair, the situation developed in tune with our assumptions and AUD/USD climbed to our upside targets earlier today.
What’s next for the exchange rate? Taking into account the buy signals generated by the indicators, we think that currency bulls will try to push the aussie higher in the coming day(s). If they manage to break above the upper border of the purple declining trend channel, we’ll consider opening long positions.
If you enjoyed the above analysis and would like to receive free follow-ups, we encourage you to sign up for our daily newsletter – it’s free and if you don’t like it, you can unsubscribe with just 2 clicks. If you sign up today, you’ll also get 7 days of free access to our premium daily Oil Trading Alerts as well as Gold & Silver Trading Alerts. Sign up now.
Thank you.
Nadia Simmons
Forex & Oil Trading Strategist
Przemyslaw Radomski, CFA
Founder, Editor-in-chief, Gold & Silver Fund Manager
Gold & Silver Trading Alerts
Forex Trading Alerts
Oil Investment Updates
Oil Trading Alerts


