The performance of an ETF is driven by the performance of its holdings. This observation should be inherently obvious, but it seems to be controversial among the investing community. Proponents of “passive” investing tell investors to ignore holdings and focus solely on past performance, costs, and sector/style diversification.
The proliferation of stock indices – there are now 3.3 million indices compared to just 43 thousand stocks globally – makes the passive view untenable. To whatever piece of the market you want exposure, there are dozens of indices with that label, all with different strategies and compositions. Any investor that buys a fund based solely on the label puts themselves at risk, and any advisor that recommends an index fund without analyzing the holdings of that fund is not fulfilling their fiduciary Duty of Care.
For years, we have analyzed[1] the holdings of over 7,500 U.S. ETFs and mutual funds daily to identify which fund managers and indices hold the most attractive stocks. We’re excited to see that others in the market increasingly understand the need for this holdings-based diligence, as evidenced by the announcement that Bank of America (
We think this increased appreciation for holdings quality research will make the market more efficient by pushing capital towards funds that hold highly profitable and undervalued stocks
In particular, the Schwab US Dividend Equity ETF (

Holdings Quality Sets SCHD Apart
SCHD is our top-rated Large Cap Value fund and one of our top-10 rated ETFs overall. Despite this fact, SCHD’s $8 billion in assets are less than a third of the $31 billion allocated to the Vanguard Dividend Appreciation Fund (VIG), our 25th ranked Large Cap Value fund.
Investors might think that these two funds, which both focus on large cap stocks with high dividends, are fundamentally similar. In that case, it would make sense for them to allocate more heavily to Vanguard, the provider with the more trusted brand.
However, Figure 1 shows that the two ETFs are not the same at all. SCHD allocates twice as much of its portfolio to Attractive-or-better rated stocks (57% vs. 28%) and half as much to Unattractive stocks (6% vs. 14%).
Figure 1: SCHD Asset Allocation Compared to VIG
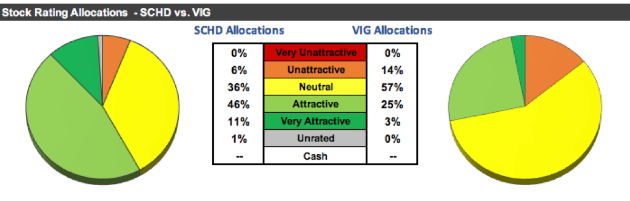
Image Source: New Constructs, LLC
Sources: New Constructs, LLC and company filings
Mary Ann Bartels, the head of BAC’s new ETF research team, explained the need for holdings-based research in a recent interview, saying:
“With all the slicing and dicing that Wall Street has done in creating all of these products, maybe we should get out of the mindset that it’s just an index and think about it as a portfolio. The construction of the index is important — and the construction is stocks — so we think you have to start looking at stocks again.”
When we look at the stocks in SCHD compared to VIG, it’s clear which one is more attractive.
Fund Flows Drive Performance of Low-Quality Stocks Too
When investors buy ETFs based solely on labels and past performance, they don’t just increase the risk to themselves. As we wrote in “Hidden Trigger For Another (Flash) Crash: Passive Investing,” passive fund flows can create a “rising tide lifts all boats” effect where low quality stocks get pushed up due solely to their inclusion in an index.
This impact can be seen in the relative performance of SCHD and VIG. So far in 2018, VIG is up 2% while SCHD is down 2%. Not coincidentally, VIG has received ~50% higher inflows of investor capital, $1.3 billion vs. $900 million.
Valuation of Holdings Favors SCHD
The holdings of SCHD and VIG have similar profitability – both average a return on invested capital (ROIC) of 13% – but the divergent performance means that SCHD’s holdings are significantly cheaper. Figure 2 compares the holdings of the two ETFs on the basis of free cash flow yield, PEBV or price to economic book value (the market valuation vs. the zero-growth value of the companies), and market implied GAP or growth appreciation period (the years of growth required to justify the valuation).
Figure 2: Valuation Comparison: SCHD vs. VIG

Image Source: New Constructs, LLC
Sources: New Constructs, LLC and company filings
Per Figure 2, SCHD rates as cheaper than VIG across all three valuation metrics. Even better, SCHD has a higher dividend yield of 2.9%.
SCHD’s Cash Flow Advantage Lowers Risk and Powers Dividend Growth
With a free cash flow yield of 4%, SCHD’s holdings generate enough cash flow to support its dividend. On the contrary, VIG’s 1% free cash flow yield is not enough to support its current dividend yield of 1.9%, much less provide the dividend growth that its name promises. See Figure 3.
Figure 3: Free Cash Flow Compared to Dividend Yield: SCHD vs. VIG
Image Source: New Constructs, LLC
Sources: New Constructs, LLC and company filings
Fund flows have helped drive VIG’s superior performance so far in 2018, but superior quality holdings should help SCHD outperform in the future.
Analysis of One of SCHD’s Quality Holdings
Despite their similar labels, the top holdings of SCHD and VIG are very different. In particular, Intel (INTC) is SCHD’s top holding and accounts for 4.7% of its assets, but VIG has no position in INTC.
INTC is a high-quality holding for dividend-focused investors. The company has raised its dividend in each of the past four years and seven out of the past ten years. Better yet, its 3.6% free cash flow yield and $21 billion in excess cash gives the company plenty of room to raise its dividend (currently yielding 2.5%) more in the future.
Most importantly, the overall economics of INTC’s business look attractive. Dividends are great, but it’s bad practice to invest in a stock that pays dividends and destroys value. INTC’s rising economic earnings per share – up 24% over the trailing twelve months – and low PEBV of 1.1 give us confidence that the company can outperform the market’s low expectations.
Why Index Construction Matters
VIG does not hold INTC due to the fact that its index – the Nasdaq Dividend Achievers index – only holds companies that have increased their dividends for 10 consecutive years.
SCHD, on the other hand, tracks the Dow Jones U.S. Dividend 100 Index. The Dow Jones Dividend 100 only requires 10 consecutive years of dividend payments, not increases, and it weights stocks based on a variety of fundamental factors, including cash flow.
SCHD’s fundamentals-based methodology does a better job of giving investors exposure to sustainably high dividends. VIG, by just using the backward-looking criteria of dividend growth, runs the risk of allocating to stocks that have grown their dividends beyond sustainable levels by taking on debt or underinvesting in the business. These companies are at a risk for reduced cash flows and dividend cuts in the future.
The Importance of Holdings Based Fund Analysis
While it is easy to pick an ETF based on a label or a 5-Star rating from Morningstar, research shows such a strategy has risks and does not necessarily lead to outperformance. Smart ETF investing means analyzing the holdings of each ETF. Unfortunately, most investors do not realize they can get high-quality research on ETF holdings and are content with investing based on past performance.
We hope that the entry of Bank of America into the world of holdings-based research will help investors realize that this level of diligence is both possible and necessary. The more this sort of diligence becomes the norm, the better it will be for individual investors and the market as a whole.
Our Robo-Analyst technology analyzes the holdings of all 67 ETFs and 893 mutual funds in the Large Cap Value style. The number of holdings in these ETFs and mutual funds varies from just 16 stocks to 1,085 stocks in a given fund. Our diligence on fund holdings allows us to find an ETF, like SCHD, with a portfolio that suggests future performance will be strong.
This article originally published on October 31, 2018.
Disclosure: David Trainer, Kyle Guske II, and Sam McBride receive no compensation to write about any specific stock, style, or theme.
Follow us on Twitter, Facebook, LinkedIn, and StockTwits for real-time alerts on all our research.
[1] Harvard Business School features our Robo-Analyst research automation technology in the case New Constructs: Disrupting Fundamental Analysis with Robo-Analysts.


