On Friday, oil bulls pushed crude oil only 14 cents above the opening price, which showed their weakness. As a result, their opponents came back and took control, taking the price of black gold below $61.50. Thanks to these circumstances, light crude lost 0.92%, but is this the end of declines?
Technical Picture of Crude Oil
Let’s take a look at the technical picture of black gold (charts courtesy of http://stockcharts.com).

In our last Oil Trading Alert, we wrote the following:
(…) On Thursday, crude oil increased to $62.21, but then pulled back, creating a doji candlestick. This means that the buyers’ and sellers’ forces leveled out during yesterday’s session, which suggests that reversal may be just around the corner – especially when we factor in the proximity to the 2015 highs, which continue to block the way to the north.
Earlier today, crude oil futures extended losses and remain below $61.50 (at the moment of writing these words), which suggests that the price of black gold will likely follow them after the market open – similarly to what we saw many times in the past.
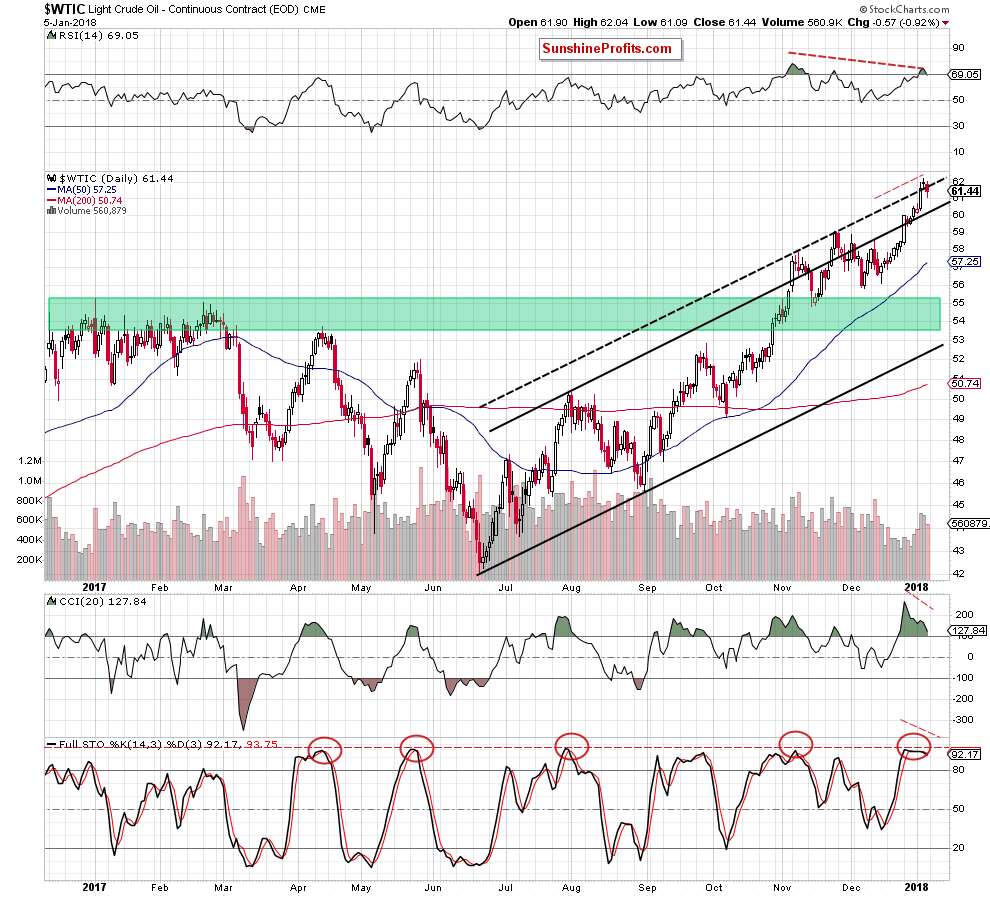
From today’s point of view, we see that the situation developed in line with the above scenario and crude oil declined after an “increase” to the daily peak of $62.04 (only 14 cents above the opening price). This show of oil bulls’ weakness encouraged their opponents to act, which resulted in further deterioration and a drop below the black dashed line. In this way black gold invalidated the earlier breakout, which suggests that we may see further declines in the coming week.
This scenario is also reinforced by clearly visible bearish divergences between the commodity and all daily indicators marked on the above chart. Additionally, the RSI and the Stochastic Oscillator generated the sell signals (while the CCI is very close to doing the same in the very near future), increasing the probability of lower prices of light crude.
How Low Could Black Gold Go?
In our opinion, the first downside target will be around $60.15, where the previously-broken upper border of the black rising trend channel currently is. However, if this support is broken, a test of the November highs will be more likely than not (around $58.99-$59.05) in the following days.
Summing up, crude oil invalidated the earlier breakout above the black dashed line, but still remans above the upper border of the black rising trend channel. Nevertheless, bearish divergences between the price and indicators together with the sell signals suggest that further deterioration may be just around the corner.
Thank you.
Nadia Simmons
Forex & Oil Trading Strategist
Przemyslaw Radomski, CFA
Founder, Editor-in-chief, Gold & Silver Fund Manager
Gold & Silver Trading Alerts
Forex Trading Alerts
Oil Investment Updates
Oil Trading Alerts


