The gold-to-copper ratio has declined recently. What does it mean for the gold market?
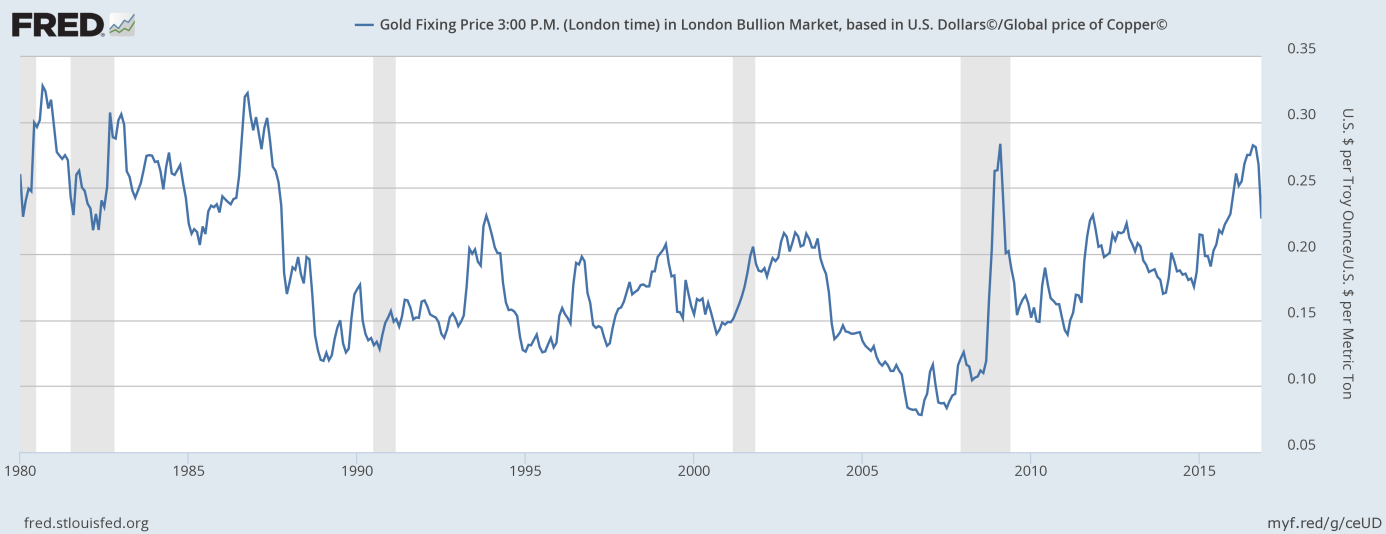
Yesterday, we mentioned the gold-to-oil ratio, pointing out that it declined from 47 in February to just about 22 in December 2016. Importantly, the ratio is not the only important indicator of the health of the global economy and the precious metals market. Another key index is the gold-to-copper ratio, which is also a leading indicator of global economic health. Why? Well, the shiny metal is a safe-haven asset, bought when the confidence in the global economy and the U.S. dollar diminishes. On the contrary, copper is a key industrial commodity purchased by industry when the global economy flourishes. Hence, the ratio may be used as an indicator of macroeconomic situation, which increases during economic slowdown or distress, while decreases when the global economy accelerates. As the chart below shows, the ratio declined from 0.28 in August to just about 0.23 in November. It means that one ounce of gold may purchase fewer tons of copper, indicating the reduced worries about the global economy.
Chart 1: Gold-to-copper ratio from 1980 to 2016. The ratio is derived from the U.S. dollar price of the ounce of gold (London P.M. Fix) and the global U.S. dollar price of a metric ton of copper (IMF).

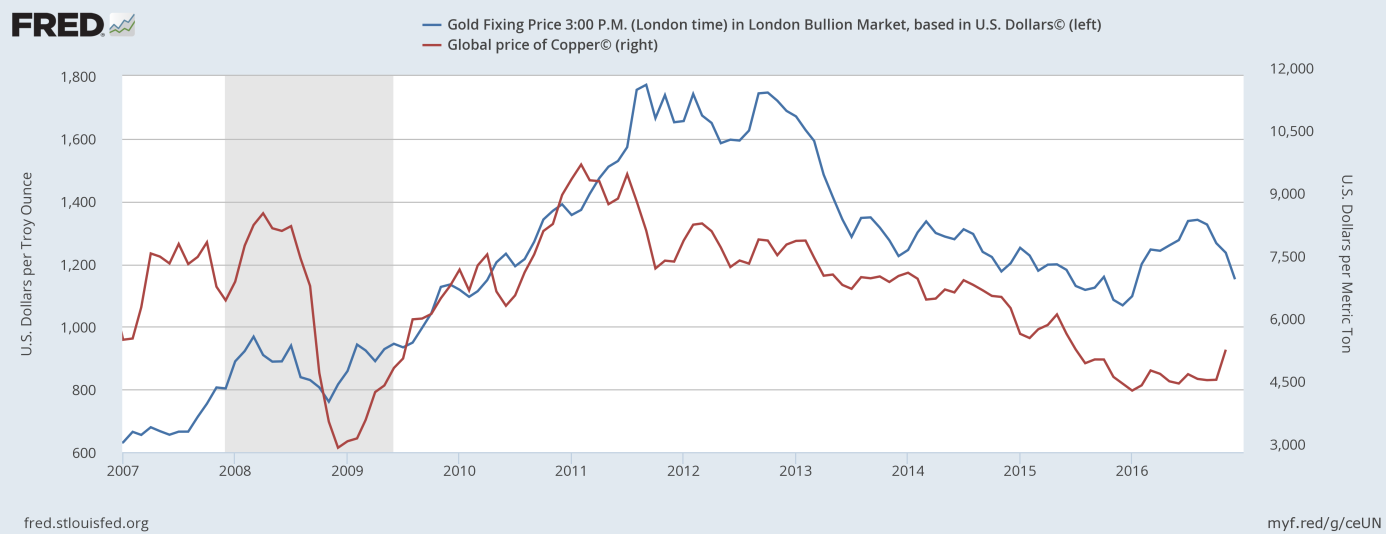
The sharp decline in the ratio in the second half of 2016 resulted from the plunge in the gold prices and a rally in the price of copper, as one can see in the chart below.
Chart 2: The price of gold (blue line, left axis, London P.M. Fix, price per ounce) and the price of copper (red line, right axis, price per metric ton) from 2006 to 2016.
Perhaps it is still too early to trump a sustainable change in the macroeconomic environment, but the divergence in prices of gold and copper is bearish for the former metal, as it signals that the economic outlook has improved recently. As Chart 1 presents, the ratio historically rose during periods of economic distress, while declined during periods of economic improvement.
Summing up, like the gold-to-oil ratio, the gold-to-copper ratio has decreased recently. It is a bearish signal for the gold market, as it indicates that the outlook for the global economy has improved. However, the expectations of faster economic growth may be too optimistic right now, which would be negative for copper prices, but positive for the price of gold.
If you enjoyed the above analysis, we invite you to check out our other services. We focus on fundamental analysis in our monthly Market Overview reports and we provide daily Gold & Silver Trading Alerts with clear buy and sell signals. If you’re not ready to subscribe yet and are not on our mailing list yet, we urge you to join our gold newsletter today. It’s free and if you don’t like it, you can easily unsubscribe.
Disclaimer: Please note that the aim of the above analysis is to discuss the likely long-term impact of the featured phenomenon on the price of gold and this analysis does not indicate (nor does it aim to do so) whether gold is likely to move higher or lower in the short- or medium term. In order to determine the latter, many additional factors need to be considered (i.e. sentiment, chart patterns, cycles, indicators, ratios, self-similar patterns and more) and we are taking them into account (and discussing the short- and medium-term outlook) in our trading alerts.
Thank you.
Arkadiusz Sieron
Sunshine Profits‘ Gold News Monitor and Market Overview Editor
Gold News Monitor
Gold Trading Alerts
Gold Market Overview


