The previous week is over and even though we haven’t seen any significant volatility in its final part, it doesn’t mean that we haven’t seen any meaningful signals. We did and one of them has important implications for the short term and a few others have much more important implications of the medium-term nature. Based on today’s sizable decline in gold and silver, it seems that the short-term signal has already worked.
The general stock market declined visibly in the last two trading days of the previous week and if the stocks are about to slide, it may be a good idea to prepare for such a decline. That’s what we’ll discuss in the following part of today’s analysis. For now, let’s start with the short-term charts and short-term signals (charts courtesy of http://stockcharts.com).
Gold’s and Silver’s Tiny Rally

In Friday’s Alert, we wrote the following about gold’s inability to move above the previous highs:
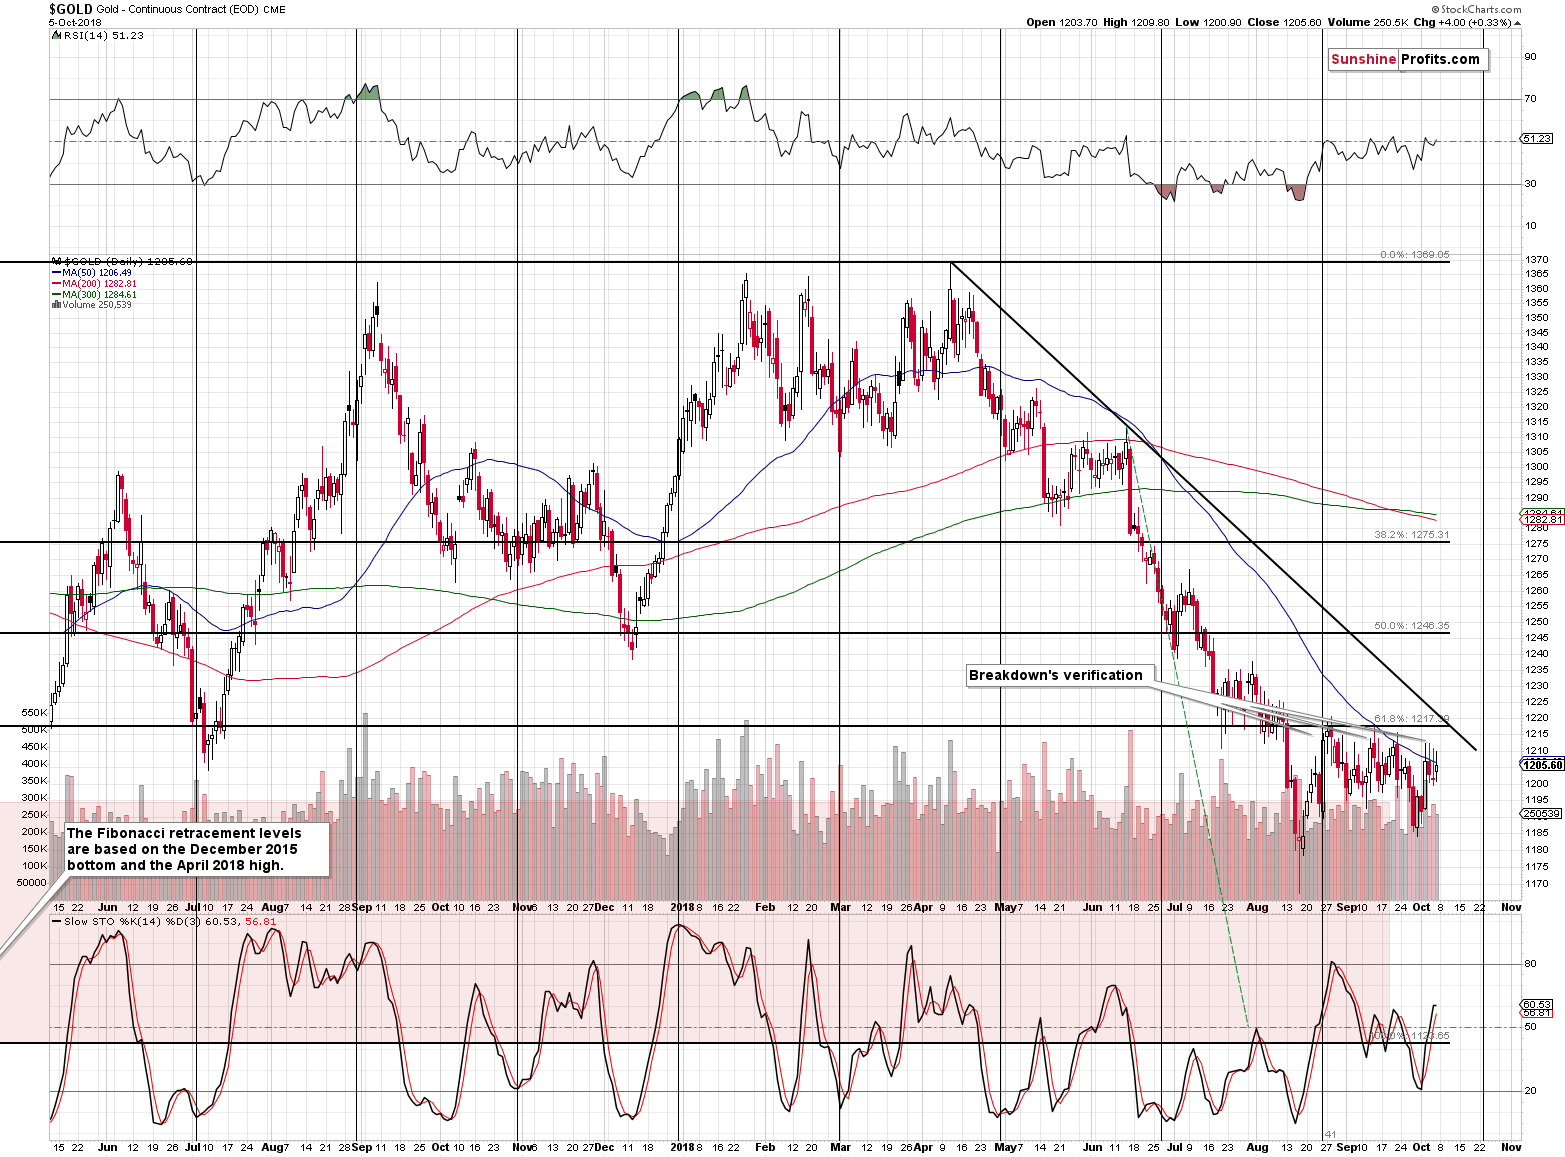
There are attempts, but each of them fails a buyers are overwhelmed by the selling pressure. And the tiny details confirm the bearish outlook. In the past 3 days, the closing prices were lower each day and we can say the same thing about the levels that the price reached intraday.
There was yet another attempt of gold to move higher and while gold ended the session higher, the intraday low was once again lower than in the previous days. Overall the tendency for gold to move back and forth but lower overall remains in place.
We saw the same thing in silver.
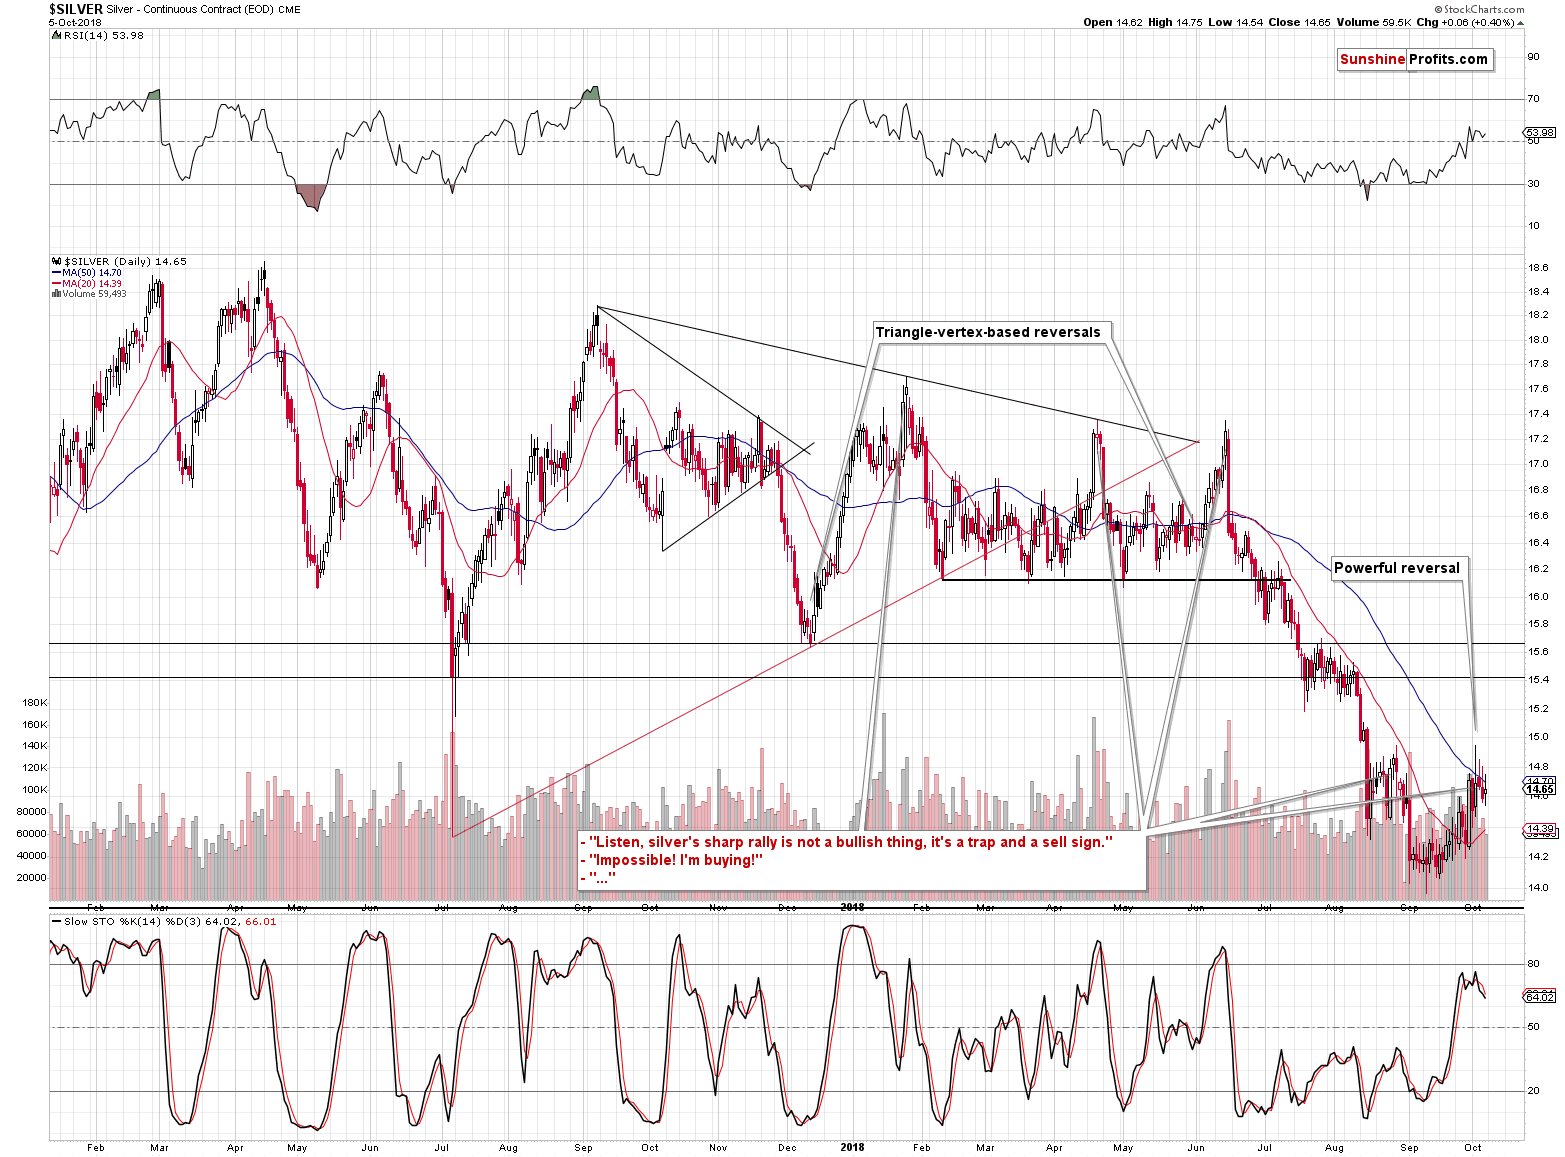
The intraday high was once again lower than on the preceding day. And once again, there was only an intraday attempt to move above the 50-day moving average that was invalidated before the session’s closing bell.
The above, plus silver’s recent short-term outperformance continue to support lower prices in the upcoming days and weeks. The outperformance can be seen even more clearly on the SLV ETF chart.
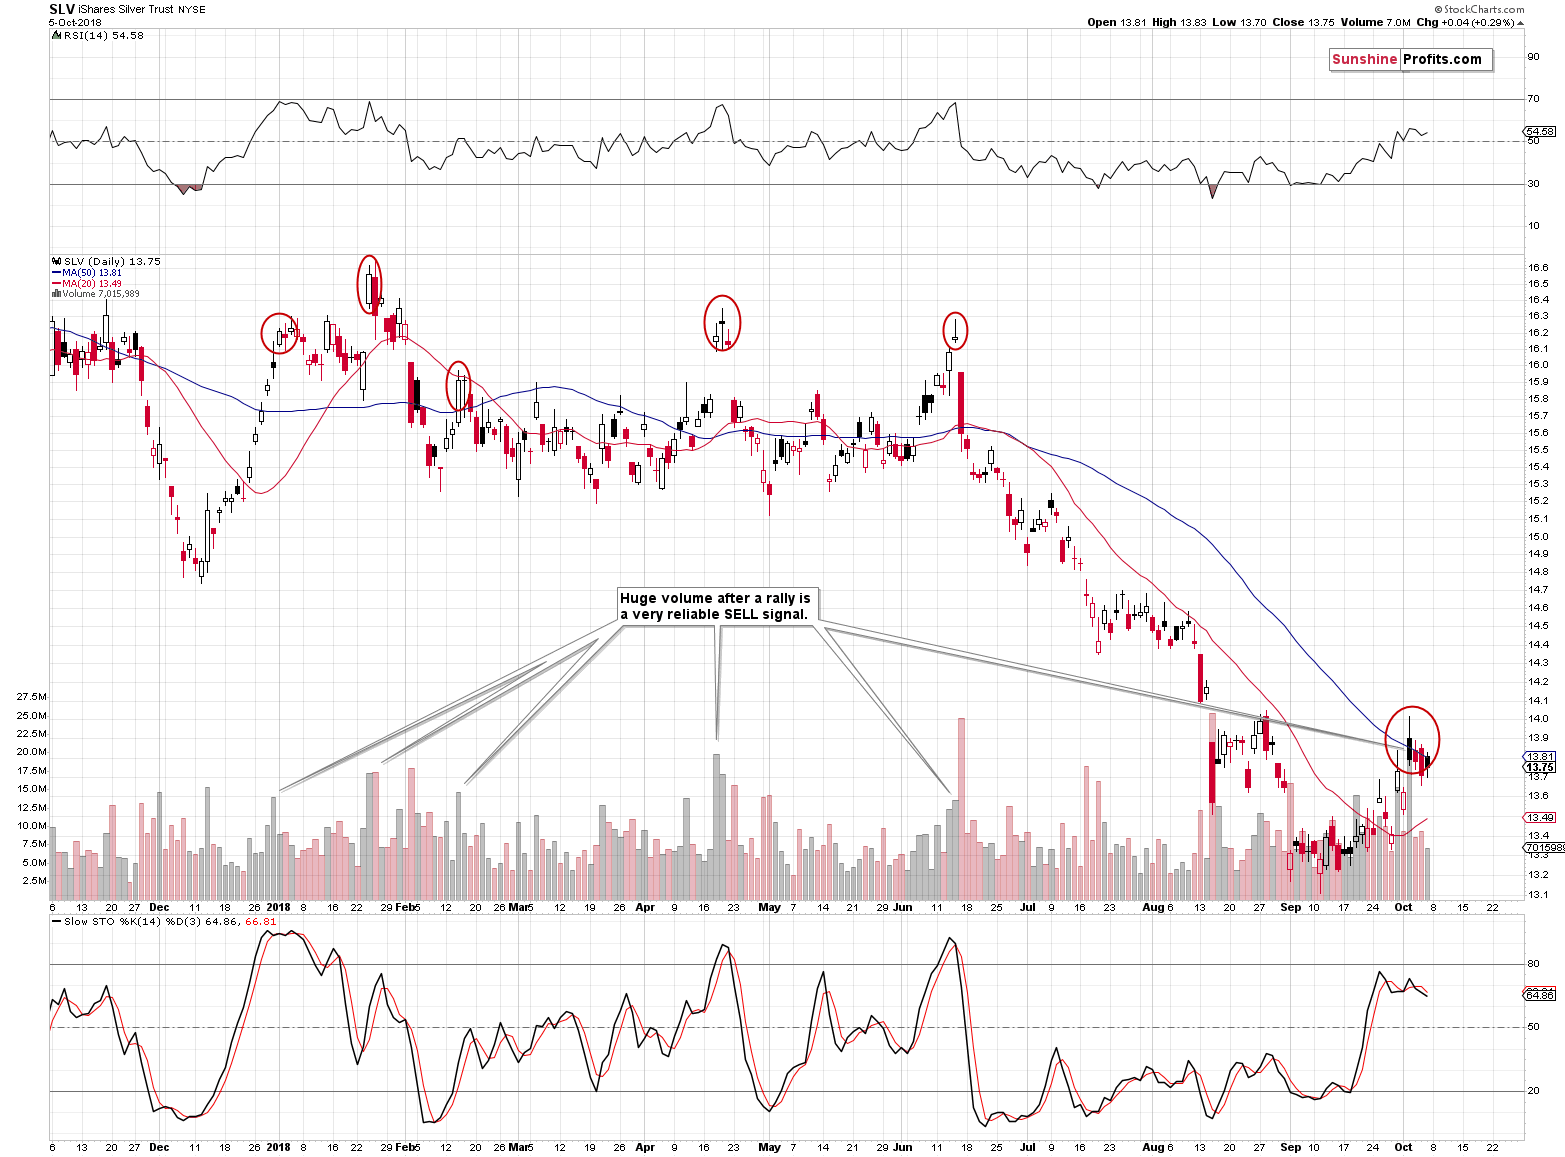
The situation now is very similar to what we saw at the previous tops, right before the significant declines, just as we described it last week.
And we have just seen an important short-term confirmation from the mining stocks.
Mining Stocks’ Short-term Signal
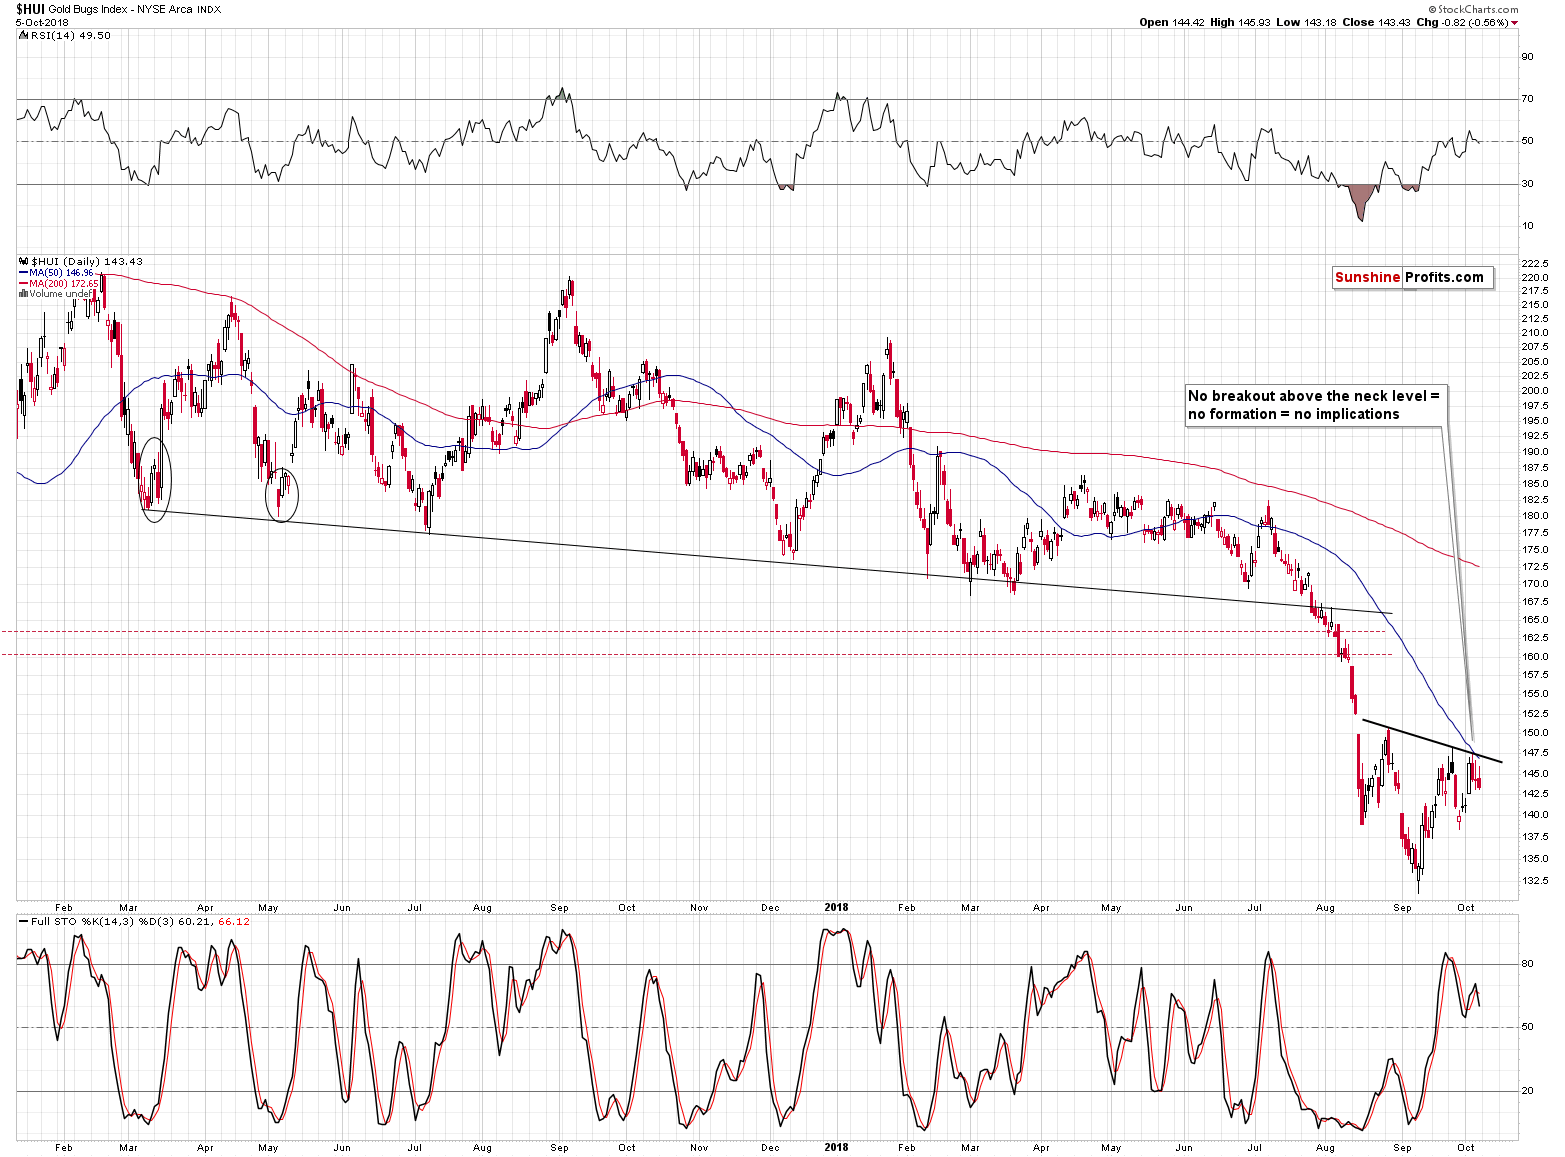
Gold and silver moved a bit lower yesterday. It’s not odd because the USD Index declined a bit on Friday. What is odd and significant, however, is the fact that despite this situation the gold stocks declined. They should have moved higher, but they didn’t which is a bearish sign. The same goes for mining stocks’ inability to complete the inverse head-and-shoulders pattern that we discussed previously.
The general stock market declined on Friday, but the move was not significant enough to really justify this extent of mining stocks’ weakness.
Preparing for the Stock Market Volatility
Speaking of the general stock market and its decline, the last two trading days were declines and while we are not yet seeing any dramatic decline, it may be a good time to prepare for such. And by preparing for it, we mean considering what might happen to the gold price if we see a significant increase in the volatility of the main stock indices. If we see the latter, we’ll also – almost certainly – see articles and interviews where people will say that gold could rally because of this increase.
By preparing for it, we mean recalling that an increased volatility in the general stock market is not likely to trigger a rally in the precious metals. That’s just an easy thing to say when being asked during an interview. Gold is often treated as a safe haven, so when investors become nervous, they will turn to the yellow metal, seeing safety. Right? As long as you don’t check the facts, it seems perfectly understandable.
But we did check the facts when the above was a popular trigger that was supposed to launch gold above $1,500. On January 31st, 2018, right after the initial decline in the S&P 500, we wrote that gold can the implications are not bullish and that gold can even decline along with the S&P.
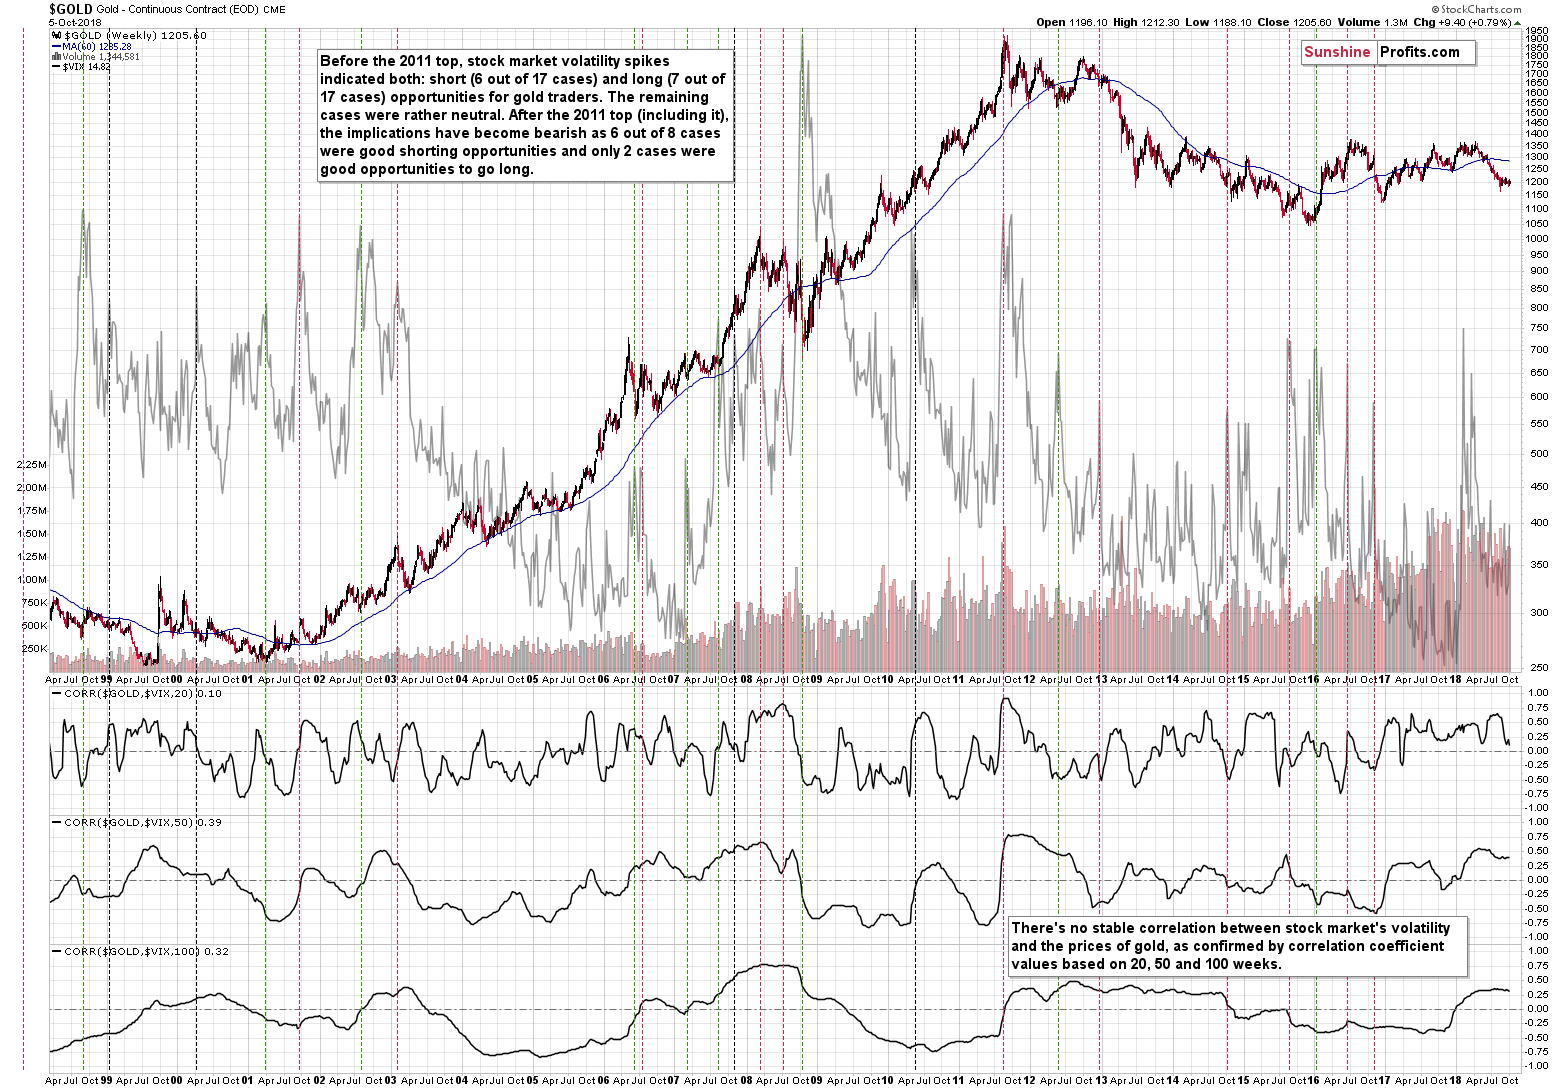
Moreover, in April, we discussed the link between gold and the volatility index – VIX. We wrote the following:
Since 2011 things have changed as 75% of cases (6 out of 8) were good shorting opportunities. The remaining 2 cases were good opportunities to go long. So, on average, it seems that as far as the current stage of the gold market is concerned, spikes in the VIX should be viewed a sell signs for gold rather than buy signs.
Naturally, the above is not strong enough on its own to make the outlook bearish, but it’s a useful confirmation technique that can supplement other, more reliable, signals.
During the most recent spike in the VIX, gold was just after a short-term upswing and the rally stopped shortly. It seems like it is yet another time when the increased volatility in the stock market confirms that we currently have a great shorting opportunity.
What happened shortly thereafter?
Gold declined, thus further increasing the bearish statistics. The current reading is that since 2011, 77.8% of cases (7 out of 9) when VIX spiked were good shorting opportunities.
The above doesn’t change anything at the moment, but please keep it in mind, if the S&P declines and you read that another decline and/or volatility is going to send gold to the moon. Quick fact-check suggests the opposite.
Now, since we are already discussing the long-term charts, let’s take a look at the current situation in the PMs from the long-term point of view.
Summary
Summing up, the outlook for the precious metals sector remains extremely bearish even though not much seems to have happened in the final part of the previous week. It’s important to keep in mind the fact that it was precisely “nothing” that directly preceded the two-day $200+ decline in gold in April, 2013. Consequently, just because nothing changed in the last two trading days, it doesn’t mean that nothing is about to. All in all, it seems that the huge profits on our short positions will soon become enormous. And Friday’s underperformance of mining stocks seems to indicate that the waiting for decline’s continuation may be over. The full version of the above analysis (today’s Gold & Silver trading Alert) includes also short-, and long-term targets for gold and silver in terms of both: price and time. We encourage you to subscribe and read the details today.
Thank you.
Sincerely,
Przemyslaw Radomski, CFA
Founder, Editor-in-chief, Gold & Silver Fund Manager
Gold & Silver trading Alerts
Forex trading Alerts
Oil Investment Updates
Oil trading Alerts


