The mining stocks moved higher yesterday and this move can be explained neither by a move higher in gold or silver, nor by a substantial rally in the main stock indices. Does the miners’ strength indicate a looming turnaround?
Quite likely yes, but the emphasis should be put on “looming” and on the fact that any turnaround here is not likely to be very significant. Let’s take a look at the charts for details (charts courtesy of http://stockcharts.com) and check the outlook for gold price in May.

That wasn’t the first day when mining stocks showed some strength, so the corrective upswing could be just around the corner. However, as you will see on the following charts, it has probably not begun yet.
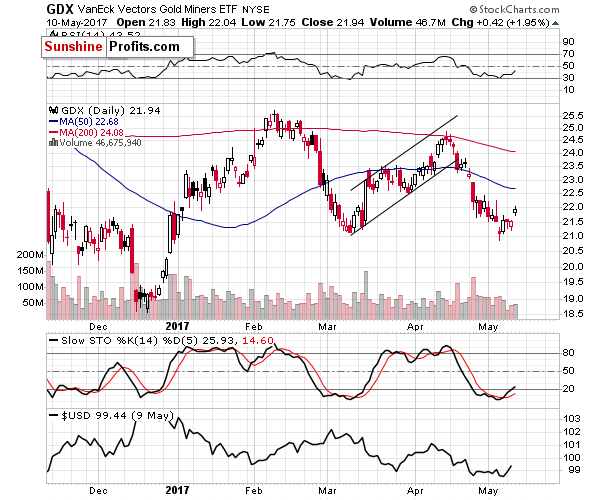
Moving back to the above chart, please note that yesterday’s upswing was accompanied by relatively low volume (higher than the last 2 days, but still low compared to what we’ve seen on average in the past weeks), so it’s not a major buy signal on its own. The buy signal from the Stochastic indicator is clearly visible, but based on how it performed in the recent past (fake buy signals in November 2016 that were followed by a decline in mid-December), it doesn’t necessarily indicate anything major.
Besides, we already discussed it several times that a corrective upswing in mining stocks could be seen shortly, but that it is unlikely to be significant.
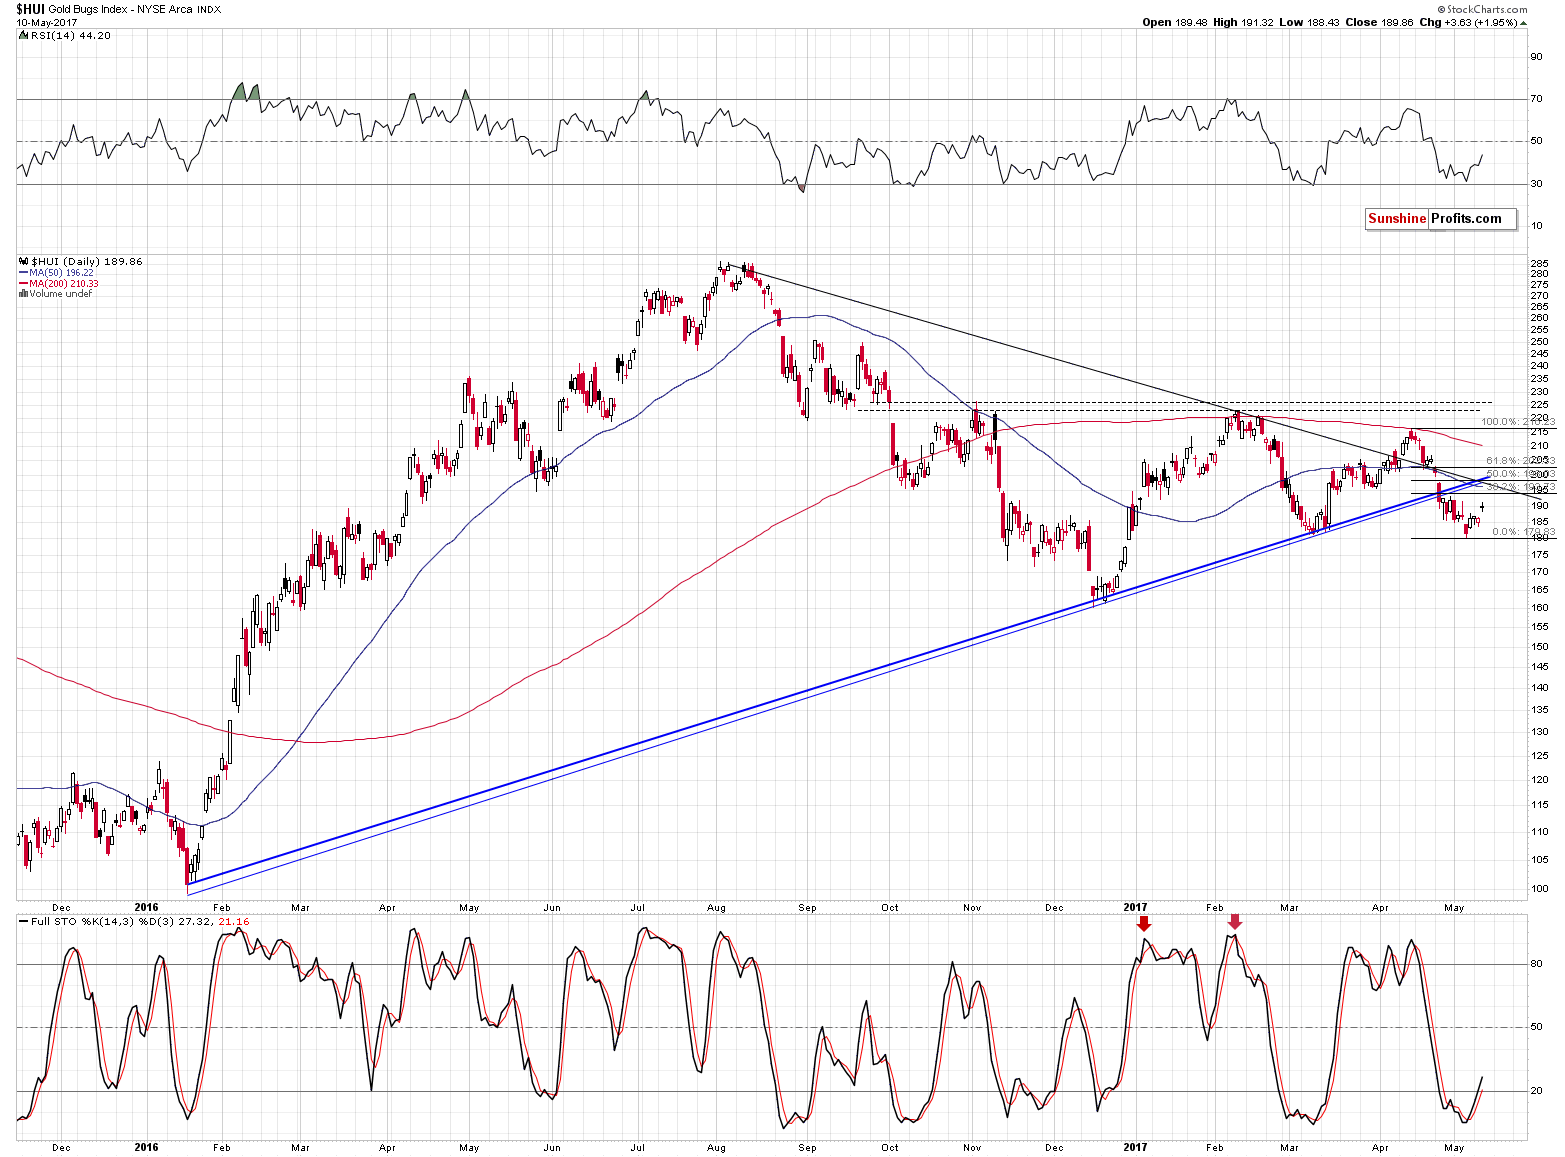
The reason for the above is the proximity of the strong resistance lines (breakdowns below them have been confirmed), the 50-day moving average and the 50% Fibonacci retracement level that coincide at about 200. Consequently, it could be the case that the rally is halfway done.
So, any resulting rally is not likely to take miners much higher. But has the rally really started? After all, gold and silver have not seen any serious price increases lately – the small upswing is only visible in mining stocks.
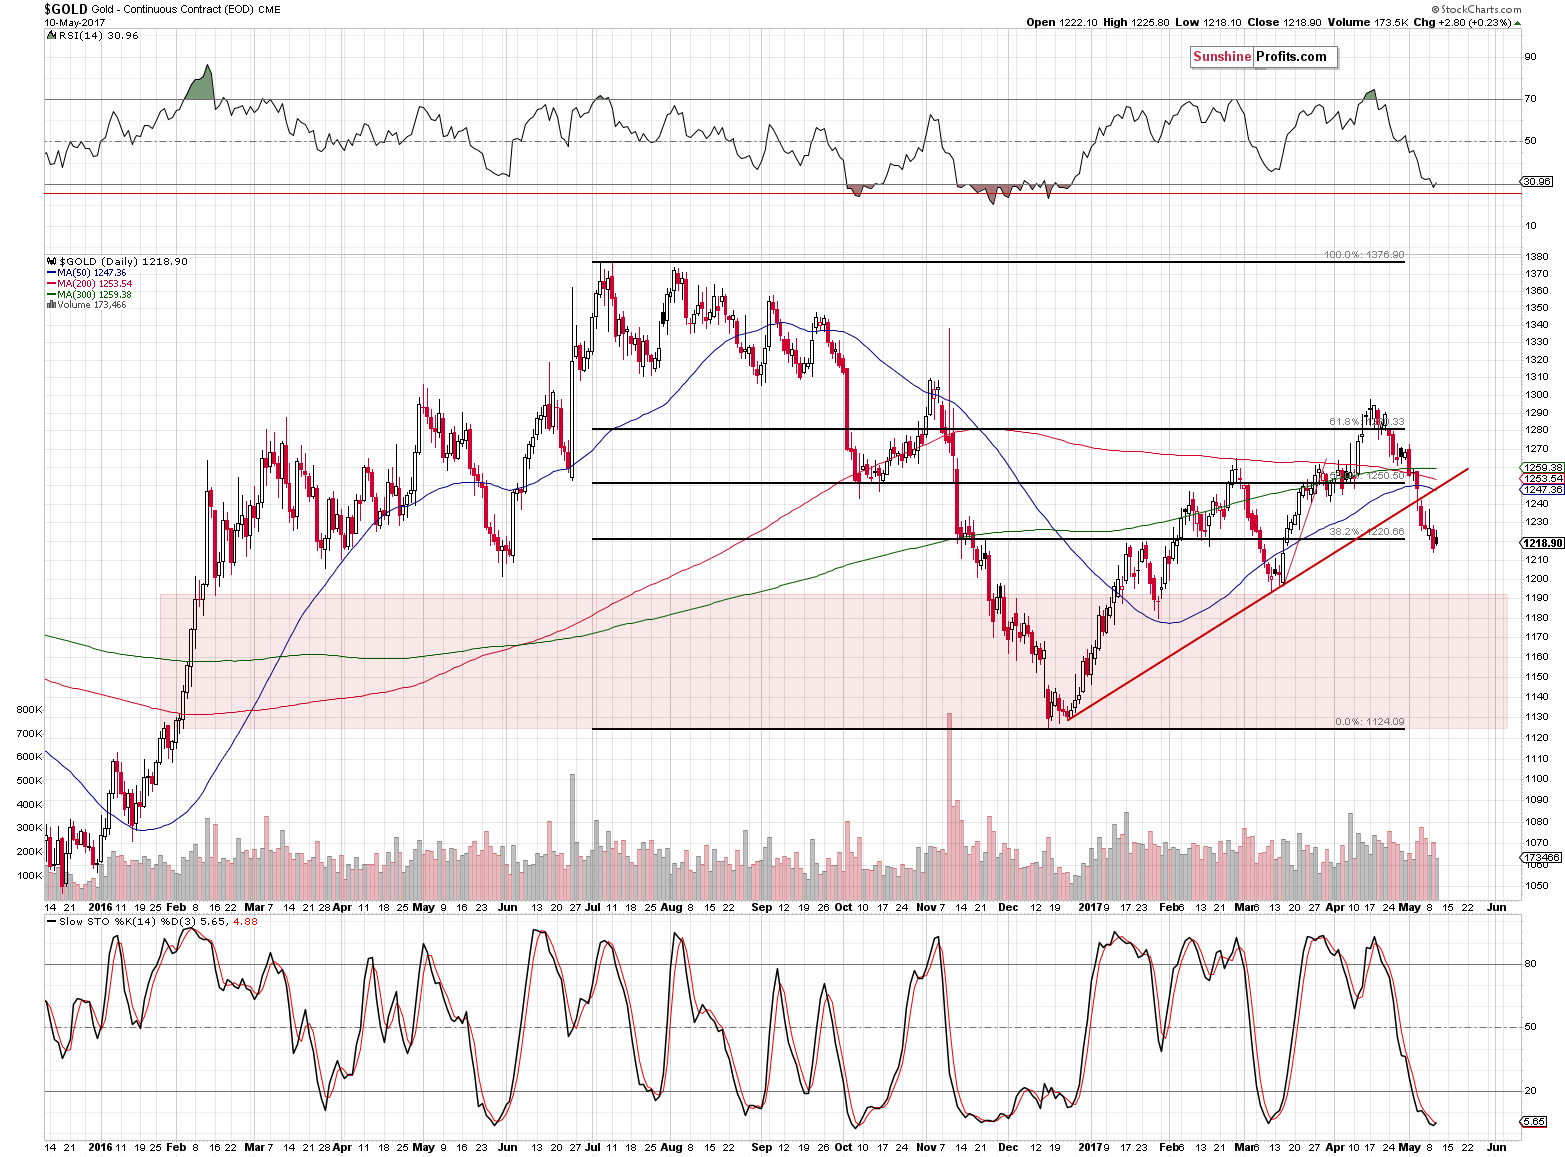
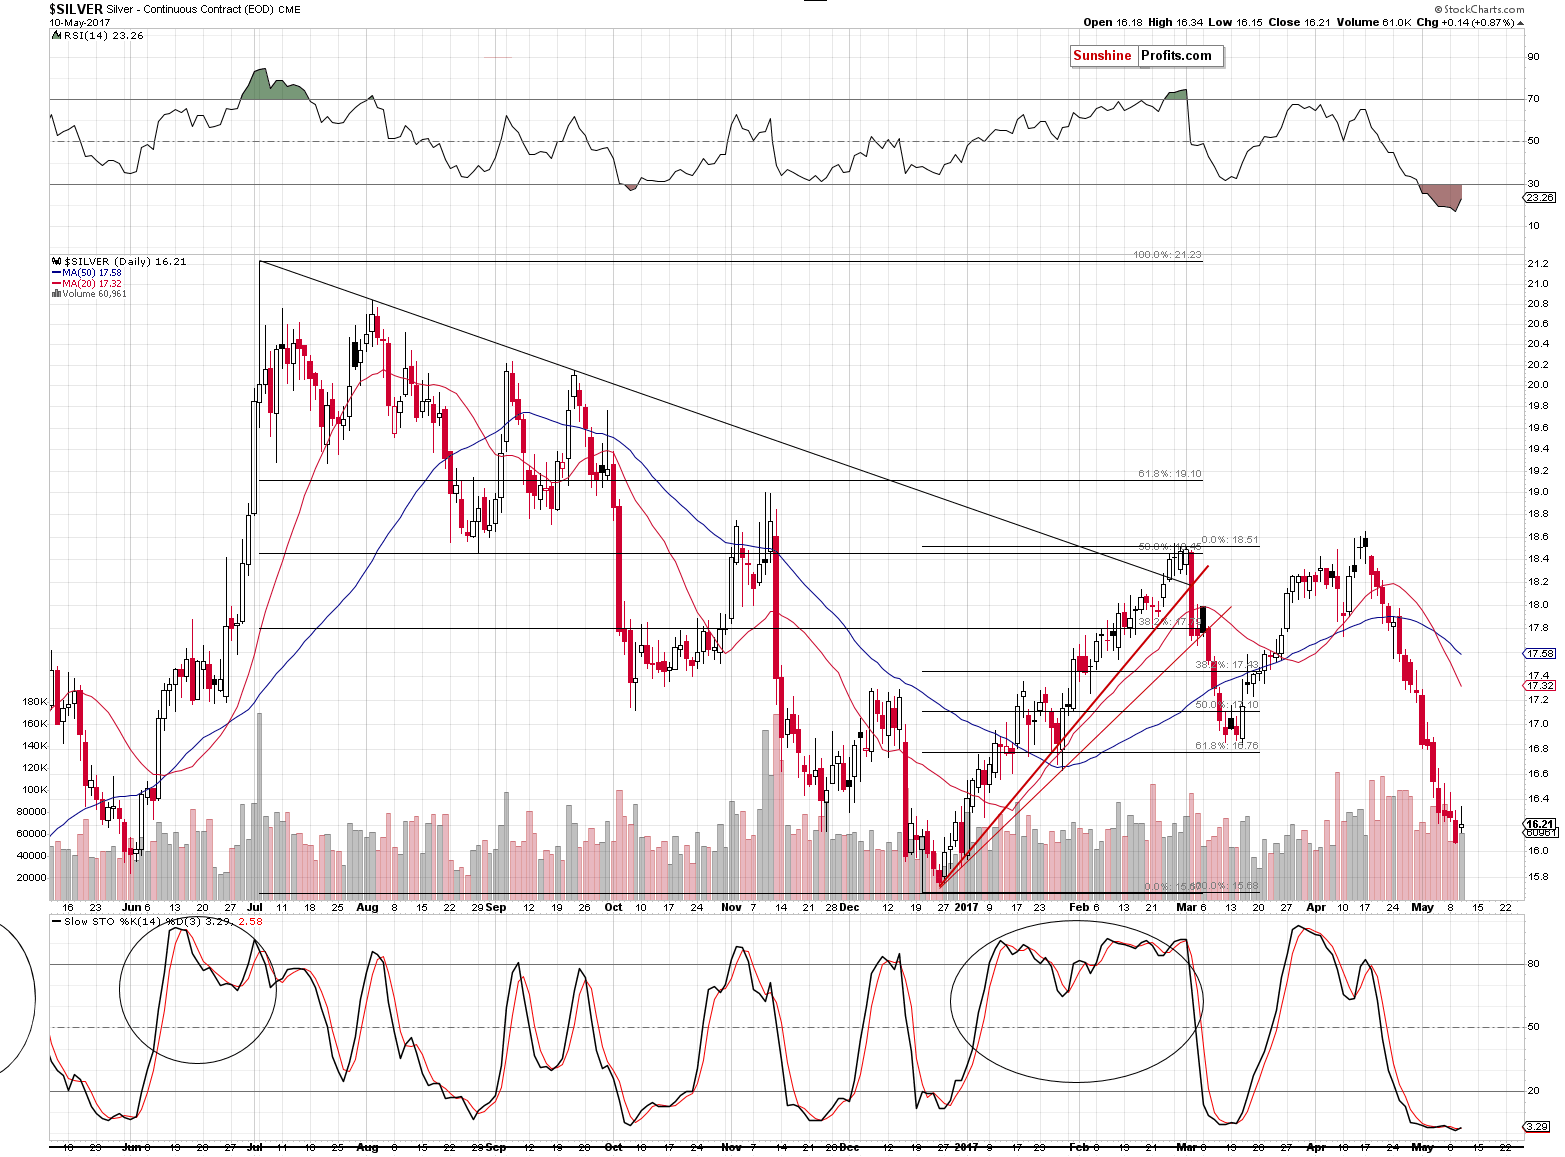
Both gold and silver moved only a little higher and the volume that accompanied these moves was low. Moreover, gold and silver didn’t reach any substantial support level that could generate an upswing. The RSI indicator in gold moved to 30, but that’s not the level from which gold started its rallies recently – the RSI moved even lower before that, reaching the red horizontal line.
All in all, it seems that metals have further to fall before a bounce becomes likely. To be clear, the medium-term trend remains down and is likely to remain down, but the markets usually don’t move up or down in a straight line and if we get enough signs that a turnaround is in the cards, we’ll temporarily change our short-term outlook.
The levels that could stop the decline for a while are: the 2016 bottom ($15.70 – $15.80) in the case of silver and the March 2017 bottom in case of gold.
The thing that could (!) trigger the correction in the precious metals mining stocks is a correction or a pause in the USD’s rally.
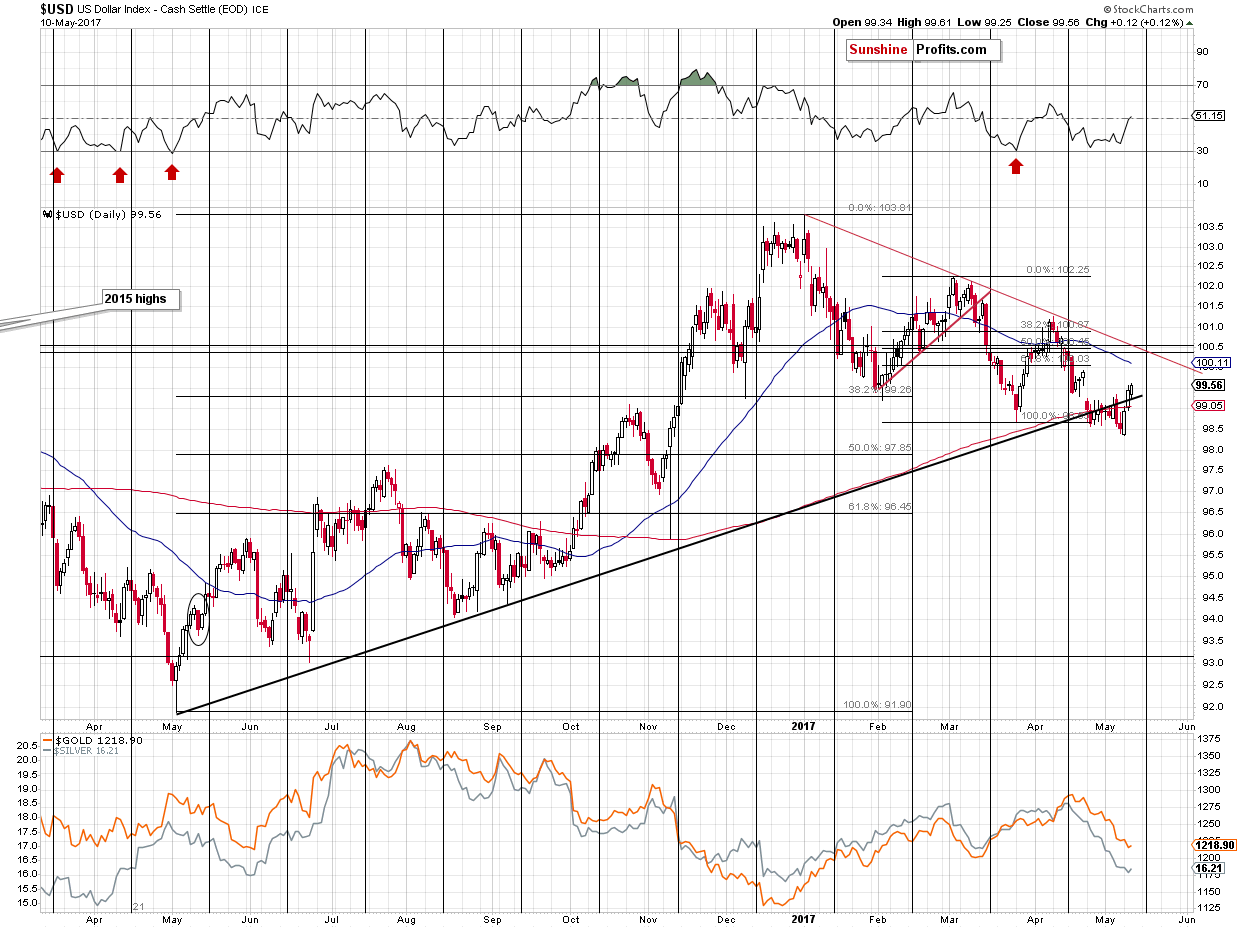
While the USD’s breakdown’s invalidation, along with the long-term charts continue to support higher prices in the following weeks and months, the proximity of the declining red support line could indicate that another pause is just around the corner, especially that the cyclical turning point (marked with vertical lines) is just a few days away.
Naturally, there’s the risk that the USD will rally right through the red resistance line, but if this is the case, then we are still likely to see a pullback to it – possibly at or shortly after the turning point.
Summing up, the outlook for the price of gold in May is bearish in general, but – based on the strength in the mining stocks and the proximity of support levels in gold and silver – it could temporarily (!) change in the following days. Whether the short-term outlook changes or not will depend on the signals and confirmations that we get once metals move lower. Naturally, the above could change in the coming days and we’ll keep our subscribers informed, but that’s what appears likely based on the data that we have right now. If you enjoyed reading our analysis, we encourage you to subscribe to our daily Gold & Silver Trading Alerts. If you’re not ready to subscribe yet, suggest that you sign up for our free gold newsletter – our daily letter with most important developments regarding the precious metals market and our free articles (including the upcoming article on gold price in June). Sign up to our gold newsletter today.
Thank you.
Sincerely,
Przemyslaw Radomski, CFA
Founder, Editor-in-chief, Gold & Silver Fund Manager
Gold & Silver Trading Alerts
Forex Trading Alerts
Oil Investment Updates
Oil Trading Alerts


