A lot happened in the first half of the year. Among many important events, Trump was nominated as POTUS, the Fed hiked its interest rates twice and announced plan to unwind its massive balance sheet, and a few important elections were held in Europe, with Macron taking over French politics. How did gold perform in that interesting period?
As one can see in the chart below, gold shined in the first half of 2017. The rally started at the end of December 2016, after the FOMC meeting at which interest rates were increased. Since then, the yellow metal gained about 10.6 percent (as of June 26, 2017).
Chart 1: The price of gold in U.S. dollars in 2017 (London P.M. Fix).
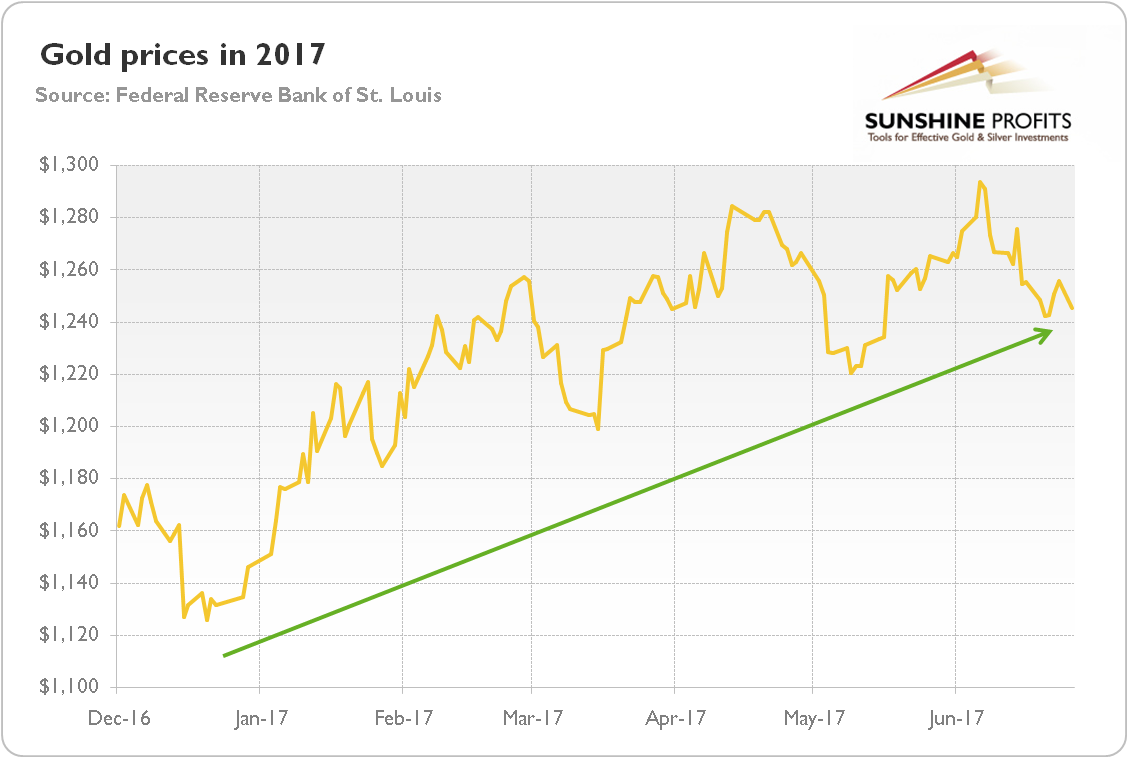

Interestingly, practically all gains were concentrated in the first quarter of the year, while gold’s rally slowed down in the second quarter. It looks a bit like 2016, when gold also soared at the beginning of the year, only to run out of steam a few months later (it would have happened even earlier, but the surprising Brexit vote supported an extension of the rally). Hence, investors should be cautious.
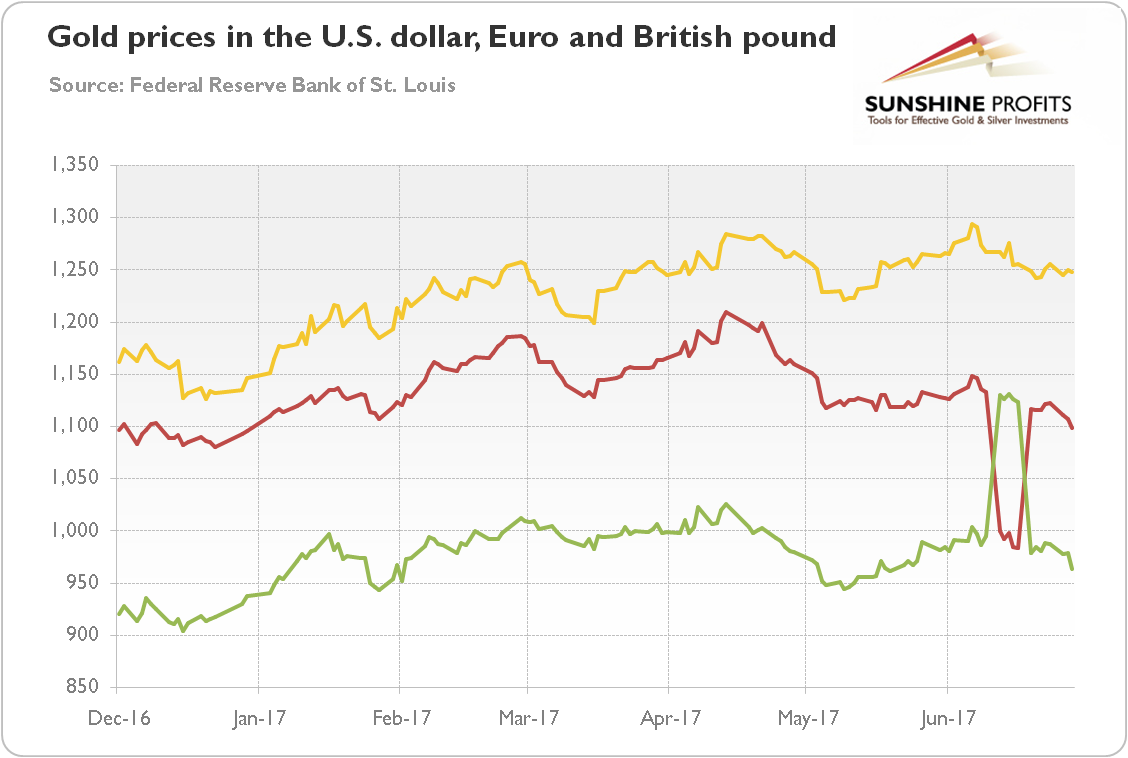
Another intriguing thing is the recent collapse (and the following rebound) of the price of gold expressed in euros and the simultaneous spike (and the following plunge) in the British pound-denominated price, as presented in the chart below. Such behavior seems to reflect an appreciation of the common currency against the British pound due to eased political risks in the Eurozone (Macron’s triumph in the French presidential and parliamentary election) and temporarily increased worries about the British political situation and Brexit after the snap general election.
Chart 2: The price of gold in the U.S. dollar (yellow line), the euro (red line) and the British pound (green line) in 2017 (London P.M. Fix).
What were the main drivers of the gold prices in H1 2017? Well, as usual we should look at the U.S. dollar and the real interest rates. As the chart below shows, the greenback and yields have been sliding this year after an impressive rise at the end of 2016.
Chart 3: The U.S. real interest rates (red line, right axis, yields on 10-year Treasury Inflation-Indexed Security) and the U.S. dollar index (green line, left axis, Trade Weighted Broad U.S. Dollar Index) in 2017.
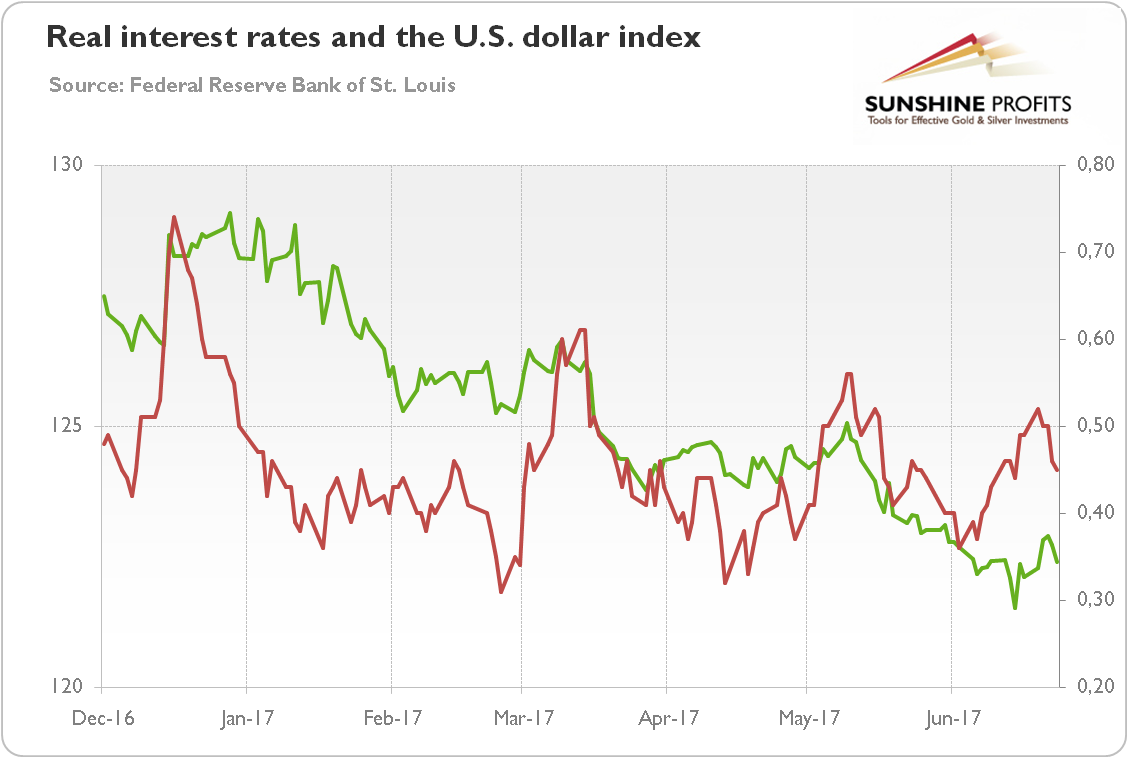
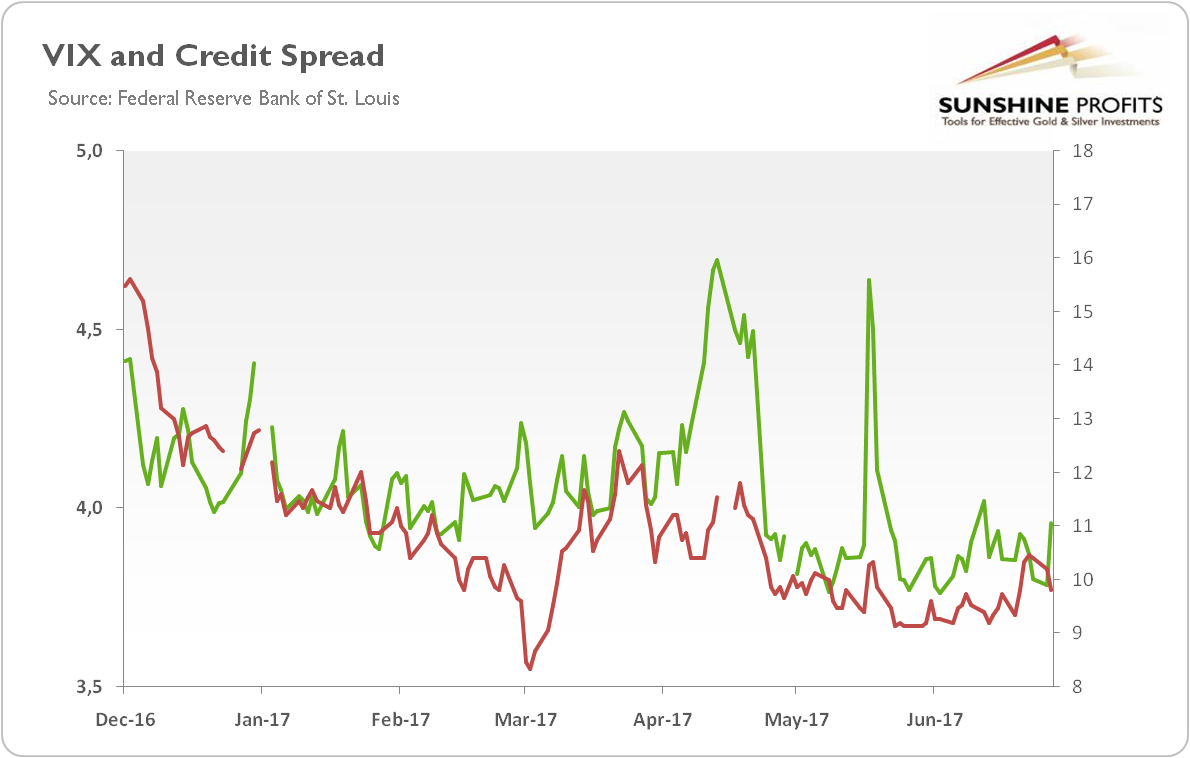
That weakness has enabled gold prices to rise. However, real interest rates rebounded somewhat in June, which could exert downward pressure on gold (but they started to decline again at the end of the month). If the Fed officials send more hawkish signals, gold may struggle. Moreover, the risk premium is still very low (measured by the VIX or credit spreads – see the chart below), while financial sector holds up well, which does not help the gold prices.
Chart 4: The market volatility reflected by the CBOE Volatility Index (green line, right axis) and the credit spread reflected by the BofA Merrill Lynch US High Yield-Option Adjusted Spread (red line, left axis) over the last five years.
On the other hand, the recent U.S. economic data have recently been worse than expected – indeed, the U.S. Economic Surprise Index plunged in June to its lowest level since August 2011. And more and more investors are now dropping assumption that Trump will cut taxes soon, boosting growth in the near future. This is why the International Monetary Fund cut its growth forecasts for the U.S. economy from 2.3 in 2017 and 2.5 in 2018, to 2.1 percent in both years. If the economic outlook deteriorates, gold may shine. However, unless we enter another financial crisis, the price rally is not likely.
What’s next for the yellow metal, then? Our stance is rather bearish as the U.S. dollar has stronger fundamentals than its major rivals, despite the recent appreciation of the euro. Trump’s administration is likely to continue implementing a pro-growth agenda (even if a bit slower), while the Fed showed determination in pursuit of tightening its monetary policy in June. Hence, when compared to the previous month, the geopolitical concerns eased further (Comey’s hearing and British snap elections are behind us), while the macroeconomic outlook has remained similar or even deteriorated slightly for gold, as the Fed was surprisingly hawkish in June. Hence, it seems that potential for further rallying has recently diminished somewhat, but significant price moves are not likely. Without some major catalysts, gold will probably remain at the crossroads.
If you enjoyed the above analysis and would you like to know more about the impact of the current macroeconomic trends and geopolitical uncertainty on the gold market, we invite you to read the July Market Overview report. If you’re interested in the detailed price analysis and price projections with targets, we invite you to sign up for our Gold & Silver Trading Alerts. If you’re not ready to subscribe at this time, we invite you to sign up for our gold newsletter and stay up-to-date with our latest free articles. It’s free and you can unsubscribe anytime.
Thank you.
Arkadiusz Sieron
Sunshine Profits‘ Gold News Monitor and Market Overview Editor
Gold News Monitor
Gold Trading Alerts
Gold Market Overview


