The first four months of 2018 were positive for the gold market. The price of the yellow metal has gained about 2 percent in that period. As one can see in the chart below, the rally started in mid-December.
Chart 1: The price of gold in U.S. dollars in 2018 (London P.M. Fix).
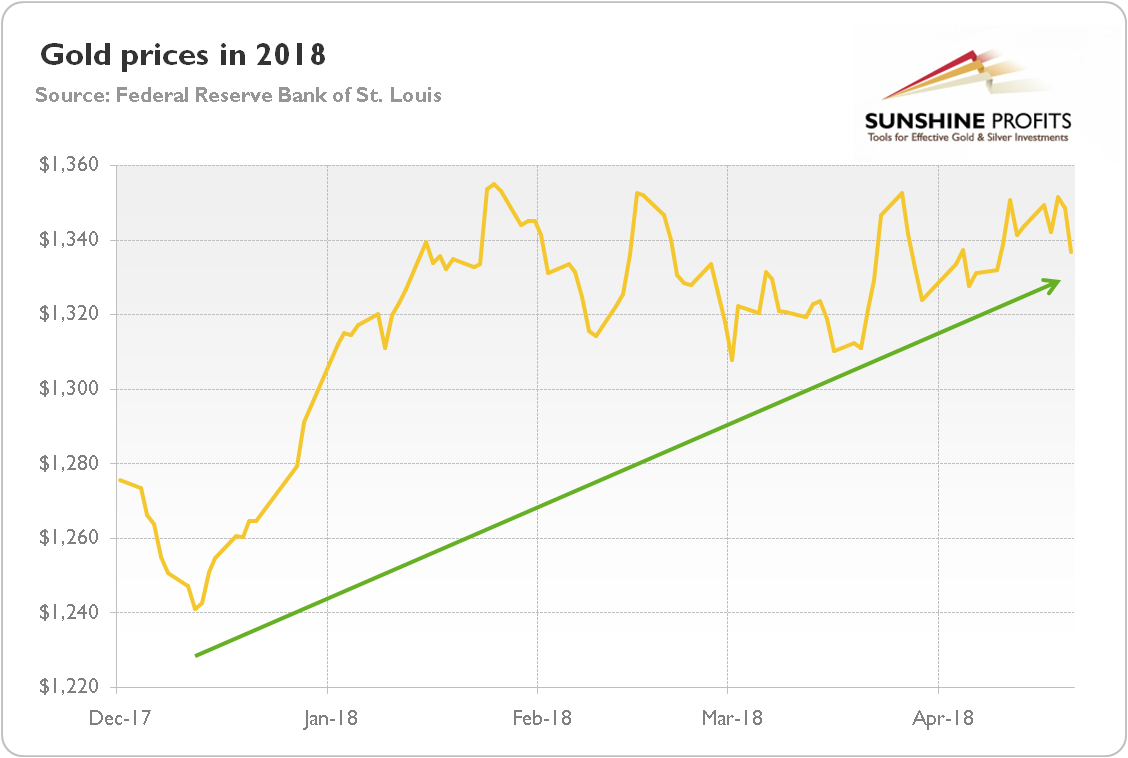

Gold bottomed at $1,240.9 on December 12, just as the FOMC meeting occurred, when the U.S. central bankers hiked the federal funds rate once again. Since then, the shiny metal gained almost 6 percent. However, let’s note that gold rallied only in December and January, while since February it has been stuck in a sideways trend until April, when it started to decline.
What were the main drivers of the gold prices in the analyzed period? First of all, the decline of the U.S. dollar. As the chart below shows, the greenback lost about 2 percent against the currencies of a broad group of major U.S. trading partners since the beginning of year until mid-April.
Chart 2: The price of gold (yellow line, left axis, P.M. London Fix) and the U.S. dollar index (red line, right axis, Trade Weighted Broad U.S. Dollar Index) from January to mid-April 2018.
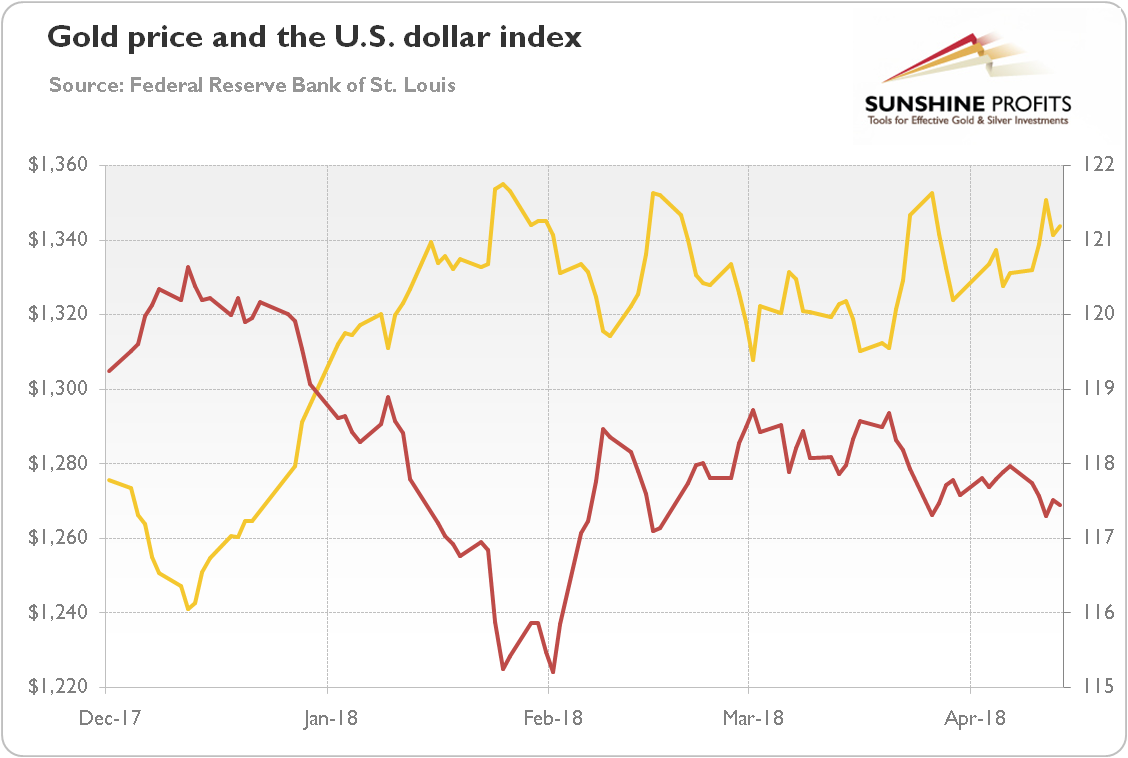
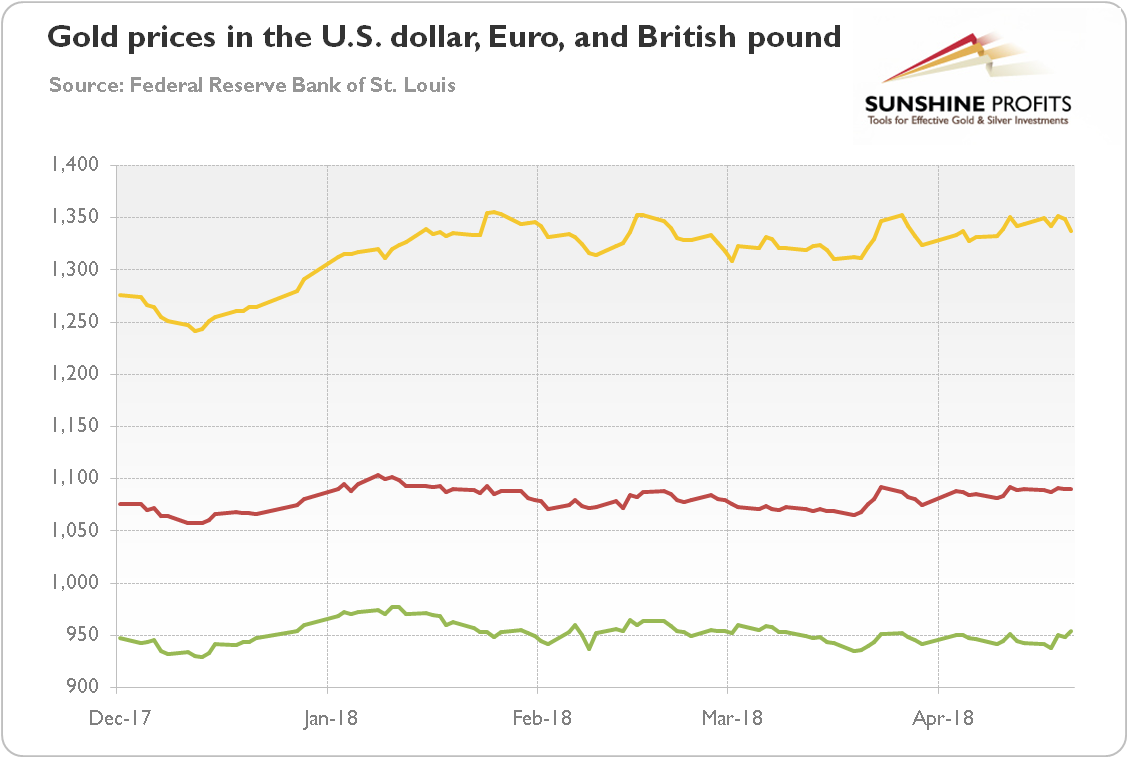
As usual, there was a strong negative correlation between these two monies. Actually, the lines look like their mirror reflections. Not surprising given a correlation coefficient as high as -0.89 (from December 2017 to mid-January 2018). The impact of the depreciation of the U.S. dollar explains why the price of gold gained more in the greenback than in the euro or in the British pound (actually, the gold prices in the latter currency declined), as one can see in the chart below.
Chart 3: The price of gold in the U.S. dollar (yellow line), the euro (red line) and the British pound (green line) in 2018 (London P.M. Fix).
However, gold gained more than the U.S. dollar lost. So, other factors had to work as well. The real interest rates are the natural candidate, as there is usually strong negative correlation between them and the gold prices.
But not this time. The standard relationship between the real interest rates and the gold prices has totally broken. As seen in the chart below, the price of gold moved in tandem with the rates. In particular, we see that the bullion prices rallied together with the rising yields rally in January and February.
Chart 4: The price of gold (yellow line, left axis, P.M. London Fix) and the U.S. real interest rates (red line, right axis, yields on 10-year Treasury Inflation-Indexed Security) in 2018.
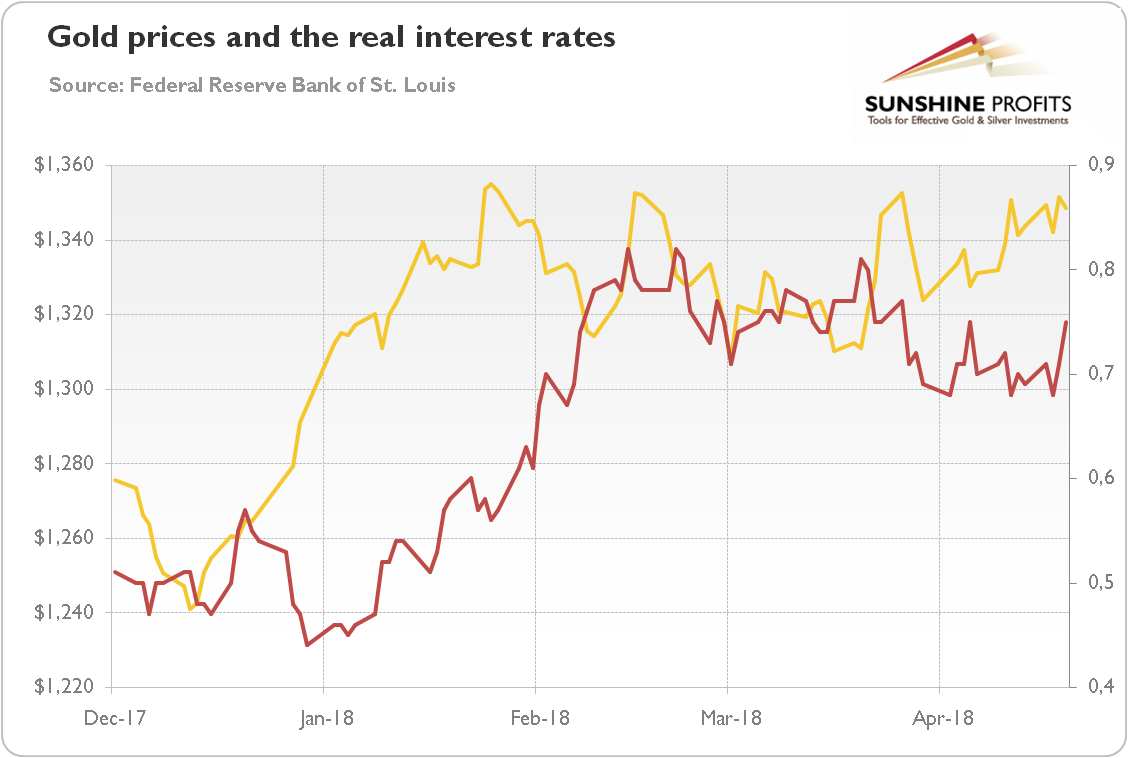
The correlation coefficient jumped from -0.52 for 2017 to 0.56 for the period starting in December 2017 and ending in April 19, 2018. Incredible! That change is perhaps the most important development in the gold market in the recent months. If the old relationship comes back again, the price of gold may go south. What we mean here is the fact that given the trend in real interest rates, the bears should have triumphed. However, the weak greenback supported bulls.
But it was not only the dollar that helped gold. Let’s take a look at the chart below. It shows the risk premium since December 2017. As one can see, risk aversion increased in the first quarter of 2018. The VIX jumped from 3.1 to 3.8, while the BofA Merrill Lynch US High Yield-Option Adjusted Spread surged from 15 to 35.
Chart 5: The market volatility reflected by the CBOE Volatility Index (green line, right axis) and the credit spread reflected by the BofA Merrill Lynch US High Yield-Option Adjusted Spread (red line, left axis) in 2018.
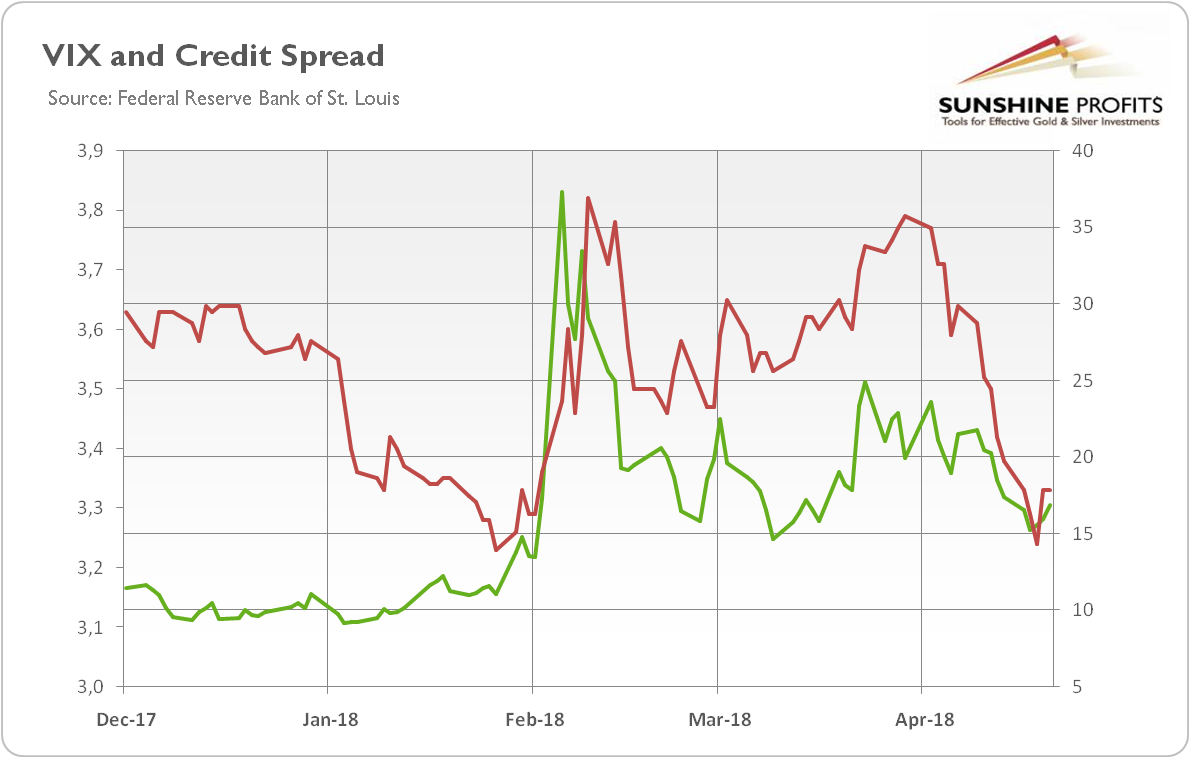
What does it all imply for the future of the gold market? Well, we believe that conclusions are rather bearish in the medium-term. The price of gold has recently been supported by the stock market correction and the resulting spike in volatility. But the risk aversion has started to decline. Not good for gold.
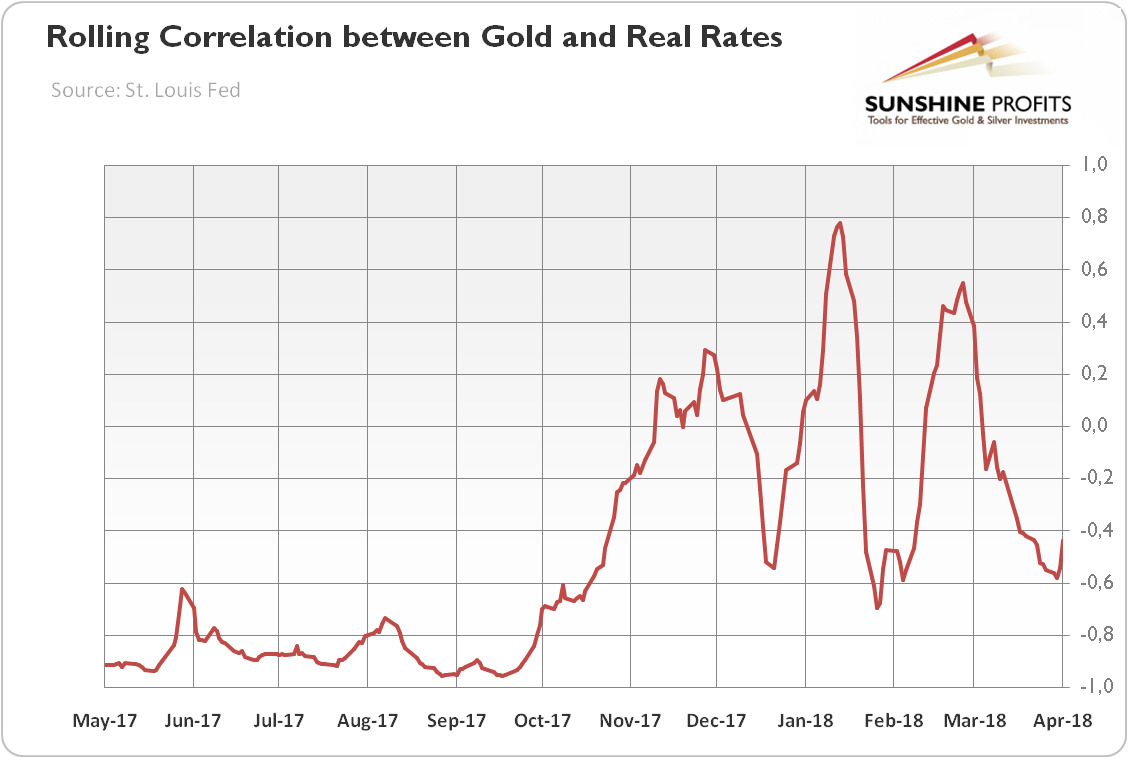
And one more thing. The key issue. The interest rates are on the rise again, with 10-year Treasury yields nearing 3 percent. We know that Trump's foreign, fiscal and trade policies are detrimental for the confidence in the U.S. dollar. However, forex investors cannot neglect the climbing U.S. rates all the time. At some point, the greenback may rebound – and then, the negative relationship between the U.S. real interest rates and the price of gold may return. Actually, the correlation has already turned negative again, as one can see in the chart below.
Chart 6: Rolling 30-day correlation between gold and U.S. real interest rates from May 2017 to April 2018.
What we are saying is not that the economic outlook is bright and gold is doomed (but the recent IMF’s World Economic Outlook suggests that advanced economies will continue to expand above their potential growth rates this year and next). We argue that the balance of fundamental risks for gold has turned to the downside. The tensions about the Korean Peninsula are diminishing. The trade wars have not broken out, despite all the worries. The interest rates are rising, but inflation remains limited. The stock market correction has not turned into crisis. The U.S. fiscal policy looks like a Trojan horse, surely, but it should not lead to the fall of Washington D.C. At least not this year…
If you enjoyed the above analysis and would you like to know more about the fundamental outlook of the gold market, we invite you to read the May Market Overview report. If you’re interested in the detailed price analysis and price projections with targets, we invite you to sign up for our Gold & Silver Trading Alerts. If you’re not ready to subscribe yet and are not on our gold mailing list yet, we urge you to sign up. It’s free and if you don’t like it, you can easily unsubscribe. Sign up today!!
Thank you.
Arkadiusz Sieron, Ph.D.
Sunshine Profits‘ Gold News Monitor and Market Overview Editor
Gold News Monitor
Gold Trading Alerts
Gold Market Overview


