Most of the World Indices have ended the cycle from the post-2009 Financial crisis low. But still, there are few Indices which are due for another cycle higher. SPX and SPY are running in an Elliott Wave Impulse structure. We at Elliott Wave Forecast believe in the idea of combining other Financial Instruments and relating them with each other. Consequently, we also combine cycles with each other. As we do understand that most of the time the Financial Market work in a coordinated fashion.
Recently, we wrote about the SPY showing the increased volatility. We explained how the Index can be doing a new high and can turn lower in a higher degree wave (IV). The most significant low in most of the Indices was in December 2018. Above from there, the price action seems to unfold as an Impulse.
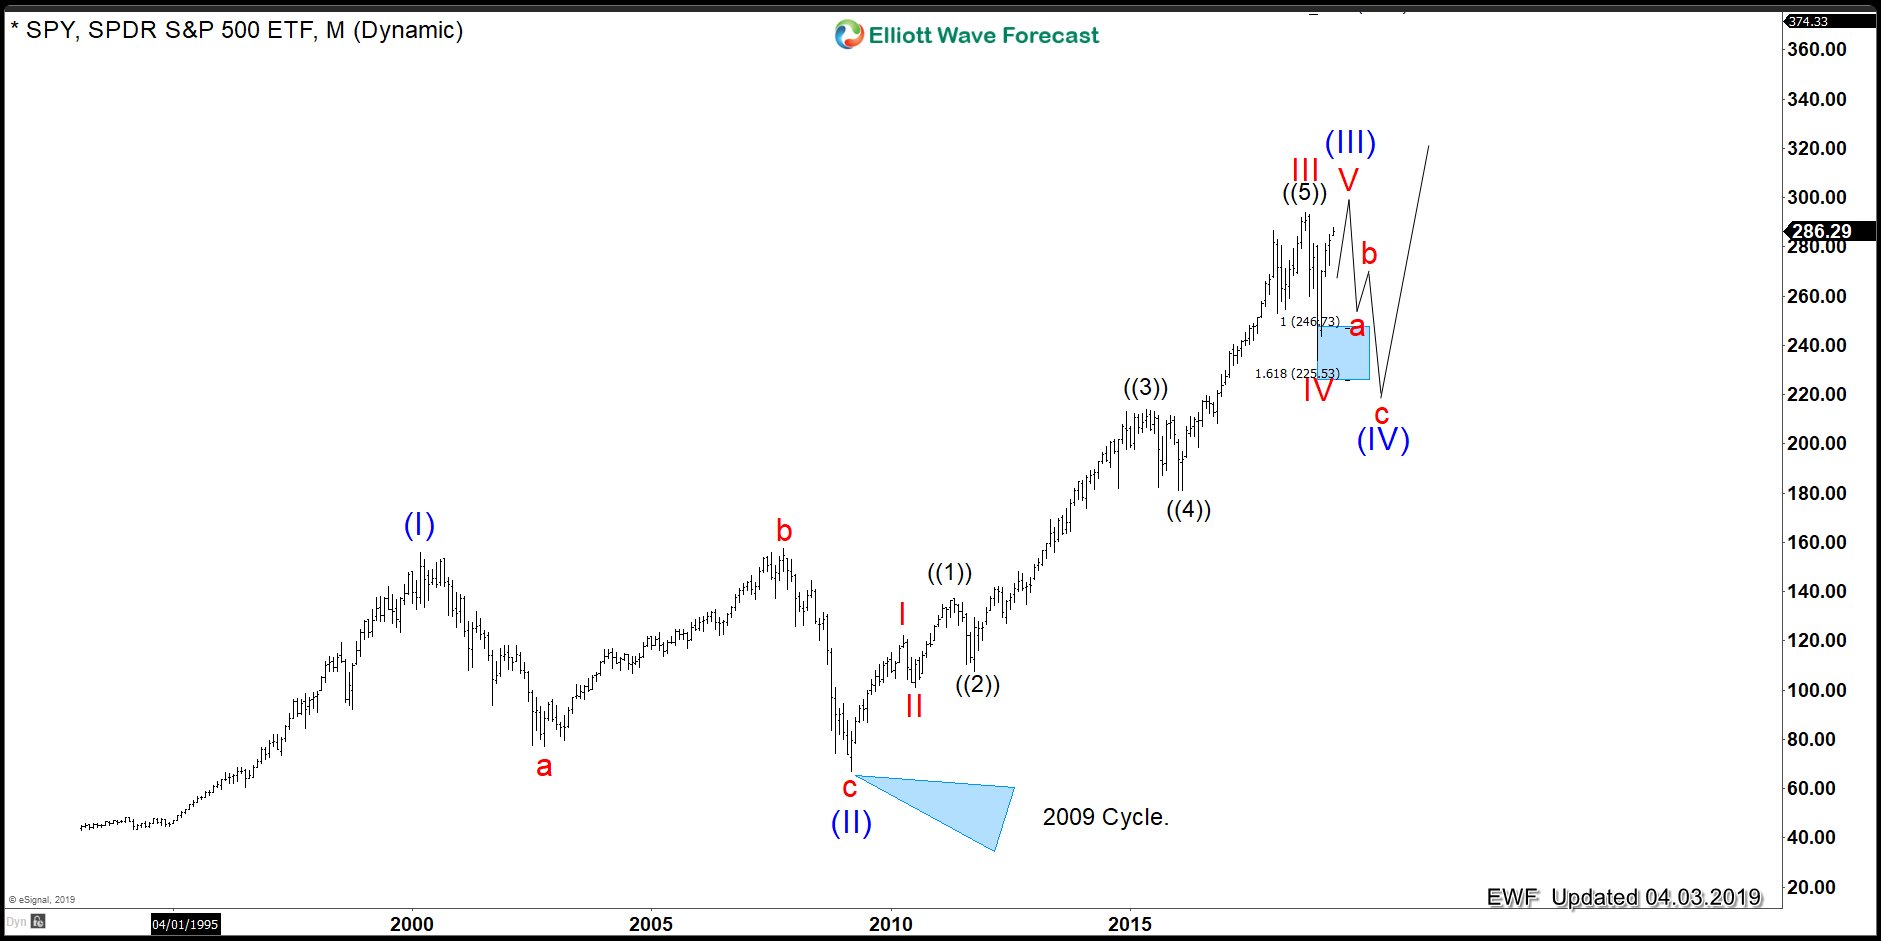
In the monthly chart below you can see that the SPY ETF
SPY ETF 04.03.2019 Monthly Elliott Wave View
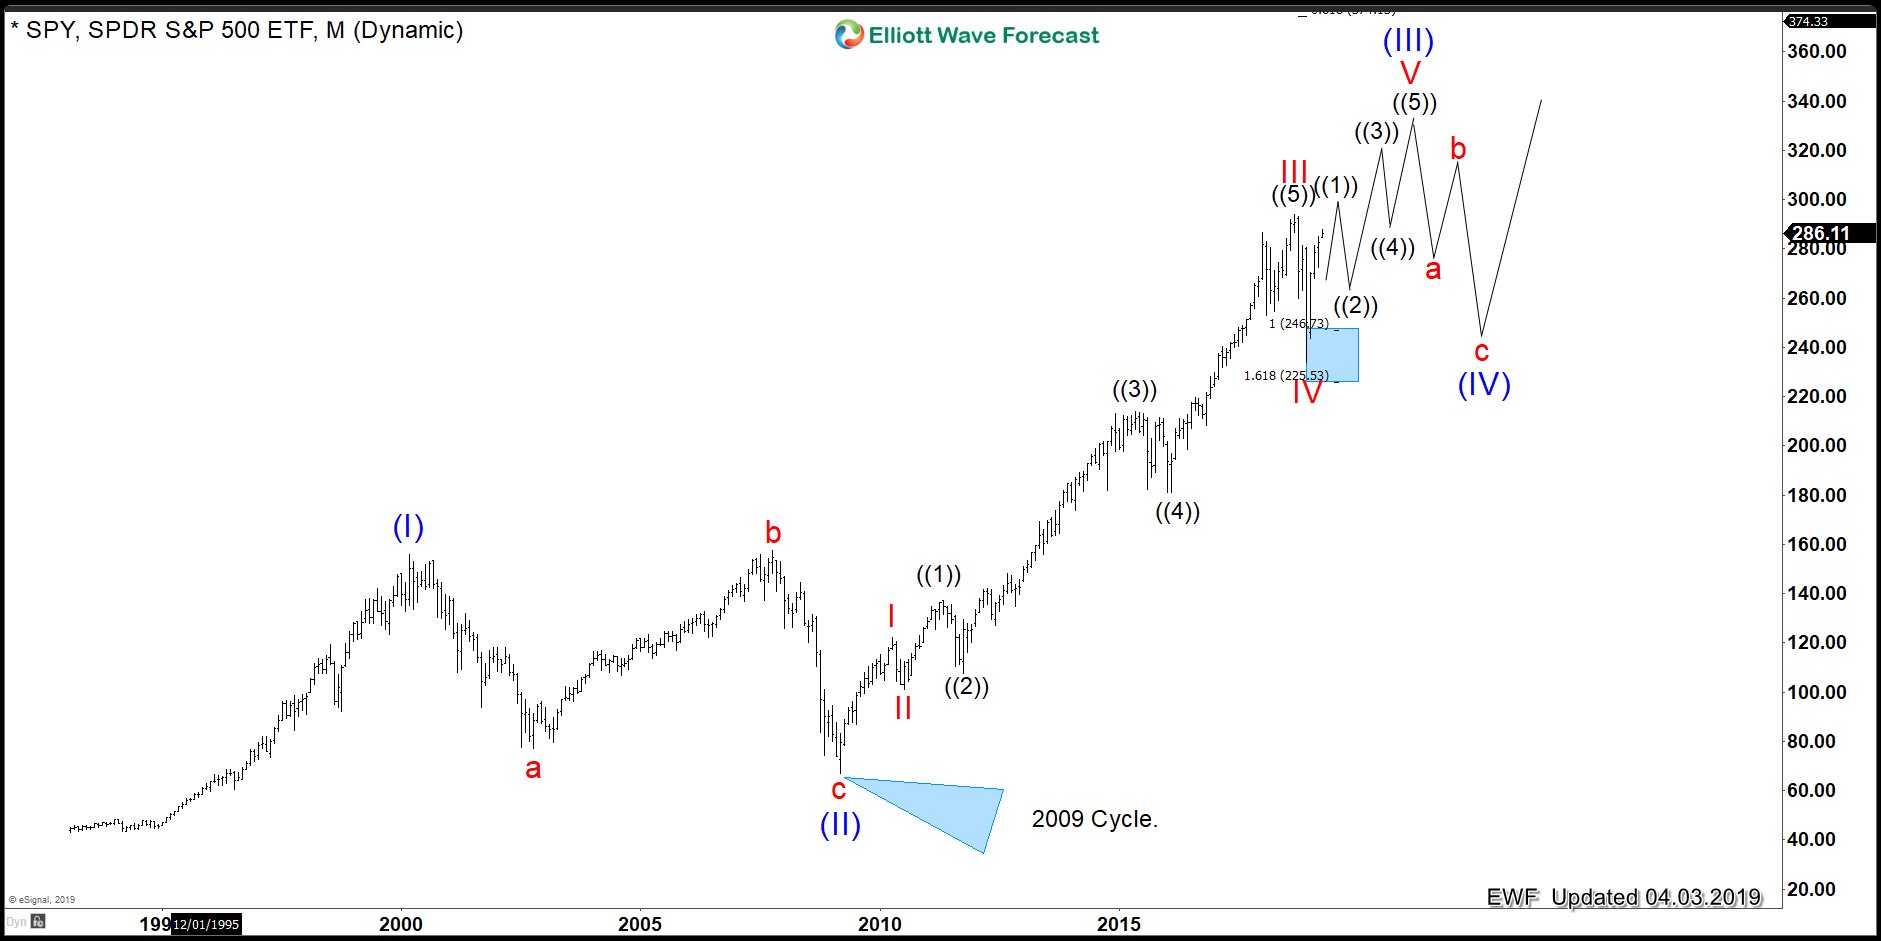
And the next chart is showing the second scenario — SPY with an extended wave V.

SPY ETF 04.03.2019 Monthly View with extended wave V
At this moment in time, we cannot tell which one of the two scenarios will end up happening based on the Elliott Wave Theory. So we look for another instrument to pick the path with a higher probability. For that let’s relate GM stock and the German DAX.
DAX vs General Motors Daily Chart Overlay
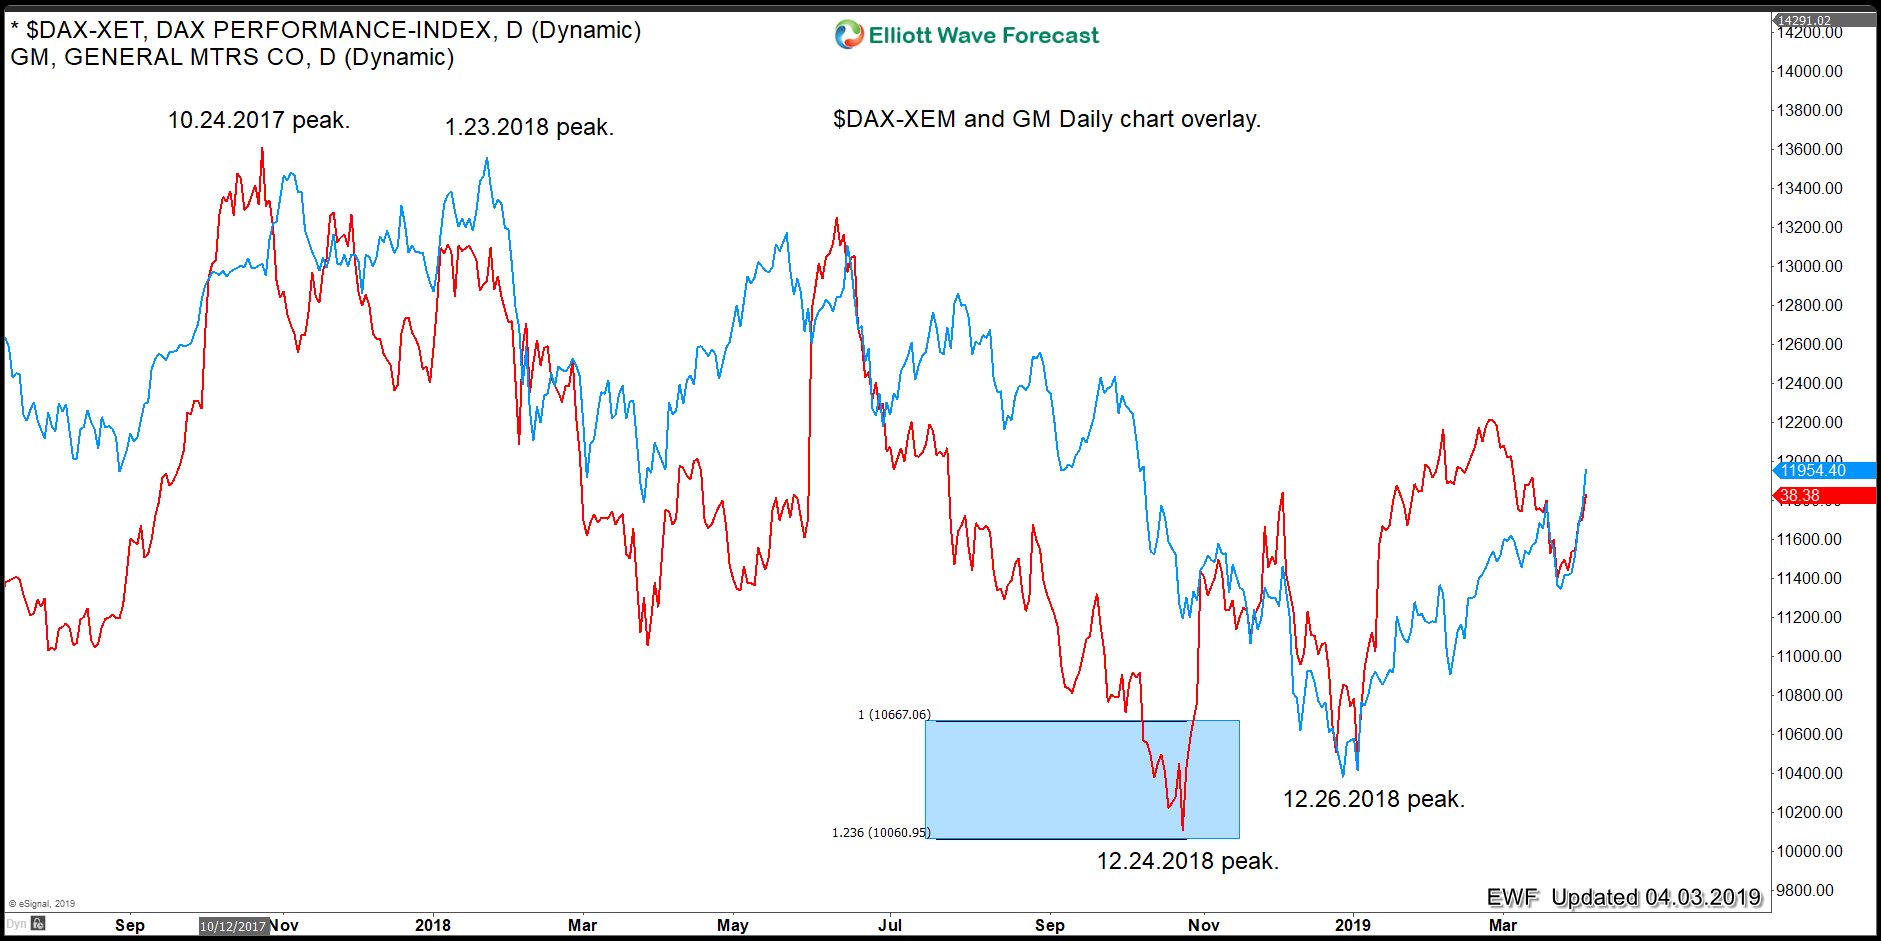
General Motors stock is always trading similar to other big World Indices. The chart above shows the relation of the DAX Index together with GM. And it is easy to see that they trade overall in the same direction. However, one of the biggest differences is that GM bottomed first when it reached 100% equal legs from the 10/24/17 peak at $30.56+ area. Also, we can see how the first pullback in GM ended on 12/26/18. And at that time we saw the low in the DAX and in other World Indices as well. Both have been trading higher since that low, and we make the following 3 observations.
1. General Motors has an early low and consequently reached 100% equal legs from 10/24/18 and found sellers at $41.50
2. General Motors ended the cycle from 12/26/18 which is the same as the World Indices cycle
3. The DAX is still trading higher within the 12/26/18 cycle and soon will reach its respective 100% equal legs area
In our system, this is a huge and important observation, because now GM will possibly dictate if the SPY ETF will extend within wave V or will end the wave V. With that said, it is now easy how to put this into context. For that, we will have a look at the chart below.
GM 04.03.2019 4-Hour Elliott Wave View
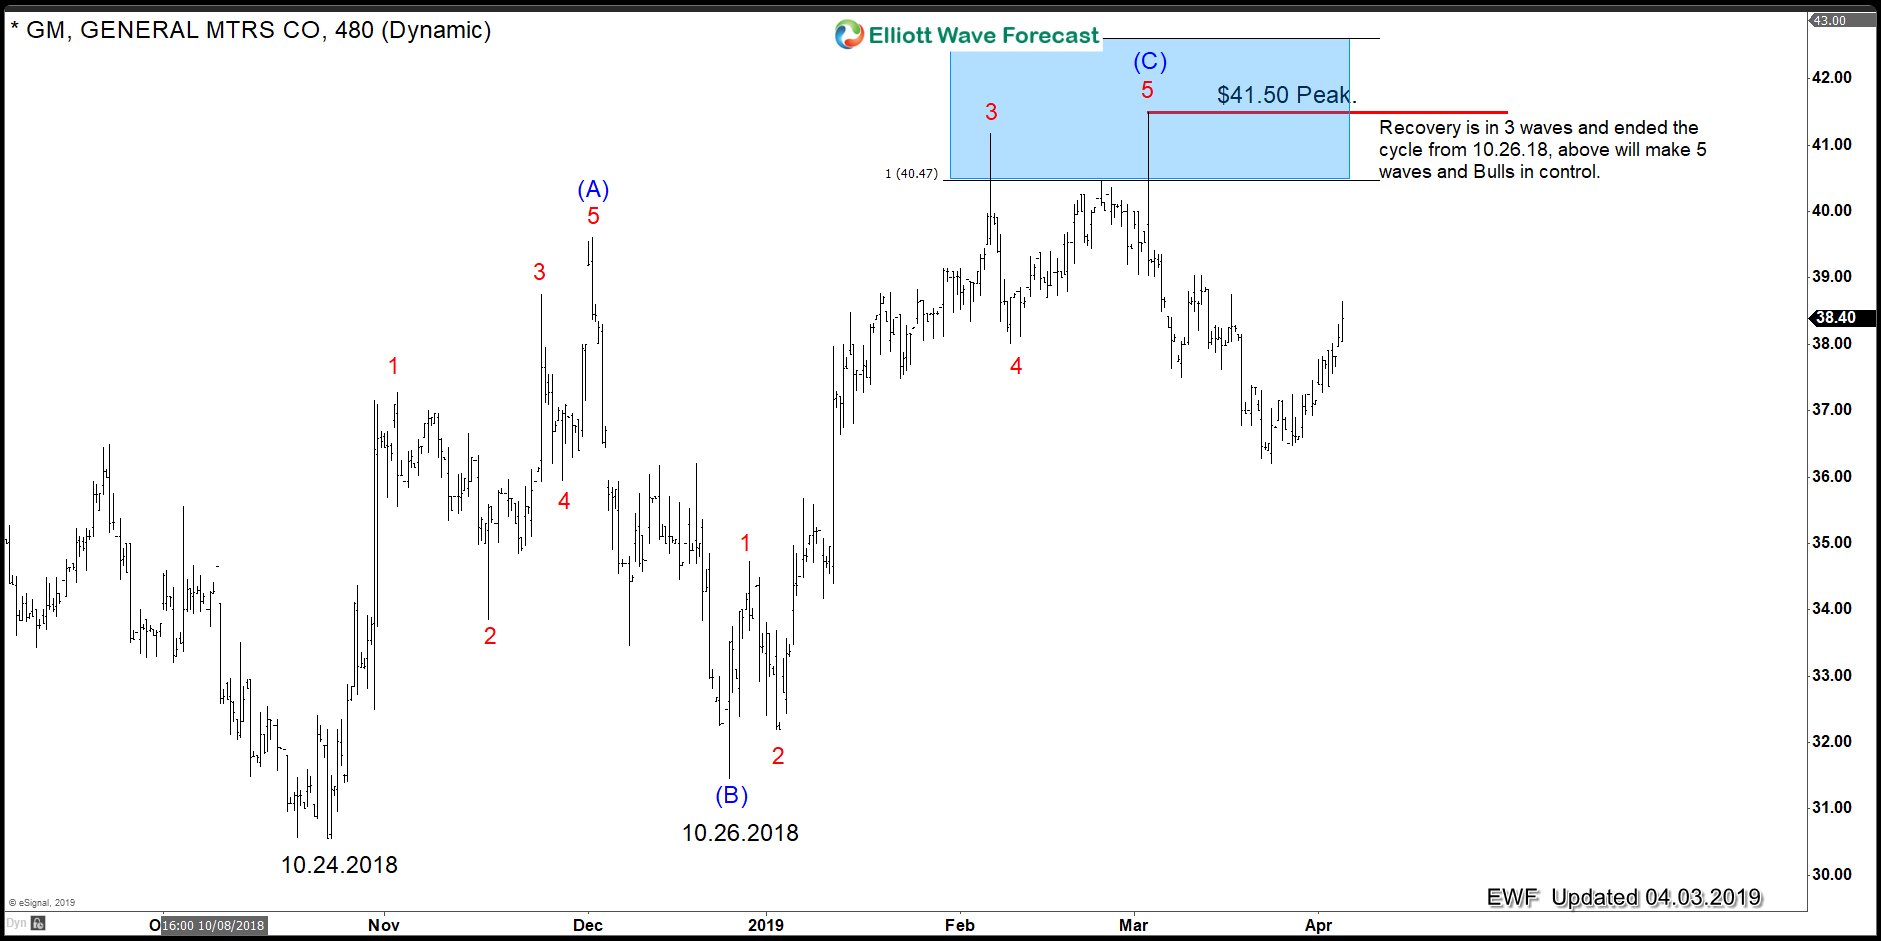
The chart is showing the price action in GM from the 10/24/2018 lows. It shows our Blue Box area which comes at around $41.50. The key is that GM needs to hold the peak at $41.50. If it breaks that peak, clearly the bears will lose control of the market. The peak at $41.50 means that it ended a 3 waves advance structure. And a break above there will mean it becomes 5 waves from the lows and consequently, more upside will be seen after a 3 waves pullback. This path would mean that the bulls would be in the driver’s seat and that will translate to the SPY ending only wave ((1)) of wave V.
But for now, we believe that, to the extenet GM holds the peak at $41.50, sellers have the chance to make another run lower and create 7 swings lower across the World Indices. Then SPY will be ending wave V and consequently wave (III).
We at Elliott Wave Forecast understand that the market cannot be forecasted based on one instrument and its price action alone. We have noticed that after years of practicing the Elliott Wave Theory. We know that adjustments and other tools are needed to get an edge over the market. We have learned that you always have more than one path to reach your destination, and, therefore, relating other Instruments is key to determining the possible outcome.


