
Q2 GDP growth is on pace to be one of the fastest of this business cycle. It should exceed the 3.1% growth in Q2 2017 making this the first time growth has increased eight straight quarters in 70 years of data, writes Don Kaufman.
CNBC’s GDP tracker shows the average out of 10 estimates is 3.7%. The range is between 3.4%-3.7%. The Bank of America Merrill Lynch tracker expects GDP growth to be 3.8%.
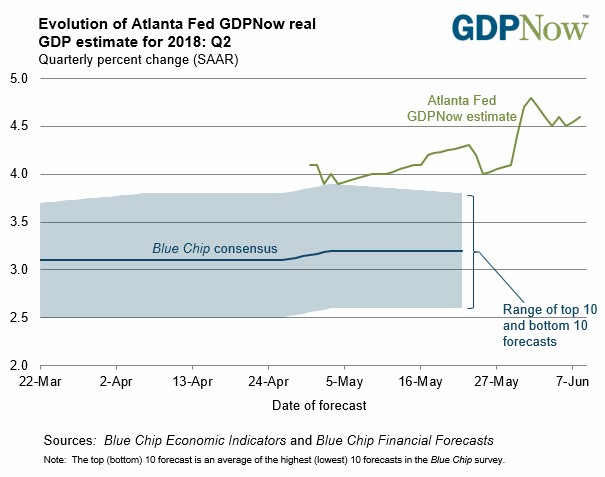
As you can see from the chart below, the Atlanta Fed’s Nowcast estimates Q2 growth will be 4.6%. The one tenth uptick occurred because the wholesale trade report caused the estimate for the contribution of inventory investment to increase from 0.99% to 1.06%.

As you can see, this time the Atlanta Fed’s estimate isn’t falling in the middle of the quarter. That’s what happens when firms get a giant tax cut which allows them to invest in capex and return capital to shareholders. Small businesses are also benefiting from the regulation cuts.
Go for Growth, Ignore Inflation
The tax cut policy looks great now because growth is accelerating while inflation is muted. If you work under the assumption that inflation isn’t an issue, then pushing an agenda of growth at all cost makes sense. That’s the agenda that was pursued; it turns out that assumption was correct.
Many economists worried about inflation after the tax cuts were passed since the unemployment rate was low. However, they weren’t focusing on Japan which has a low unemployment rate and low inflation. Demographics are pulling down rates and inflation.
If we are in a situation where rates fall in the long term as the population ages, it would make sense for the Fed to lower its goal for inflation. However, since the goal remains 2%, there’s little worry about it right now.
Since the Fed has a better understanding of inflation now than it did in the 1970s and early 1980s and the population is aging and growing slowly, the risk of runaway inflation is basically non-existent.
Q3 GDP Estimate Released
The St. Louis Fed Nowcast is also positive as it expects 3.72% growth. The most bearish estimate I’ve seen is from the New York Fed Nowcast. Its growth estimate fell from 3.26% to 3.08% on Friday. The trade data hurt the estimate by 0.18%. The Q3 estimate was released.
The Q3 estimate fell from 3.01% to 2.89%. The fear is economic growth will decline in Q3. This report doesn’t quell those fears, but hedge your fears because the NY Fed is also relatively bearish on Q2.
I mentioned in a previous article that economic growth and stock returns aren’t the same thing. We’ve seen a few quarters this cycle have over 4% growth. The subsequent deceleration never caused a bear market. I wouldn’t be worried about a possible bear market if GDP growth ends up between 2.5% and 3% in Q2. I don’t have much of a feel for how Q3 growth will turn out; I’m merely saying how I would react if that occurred.
Global Rate Hikes
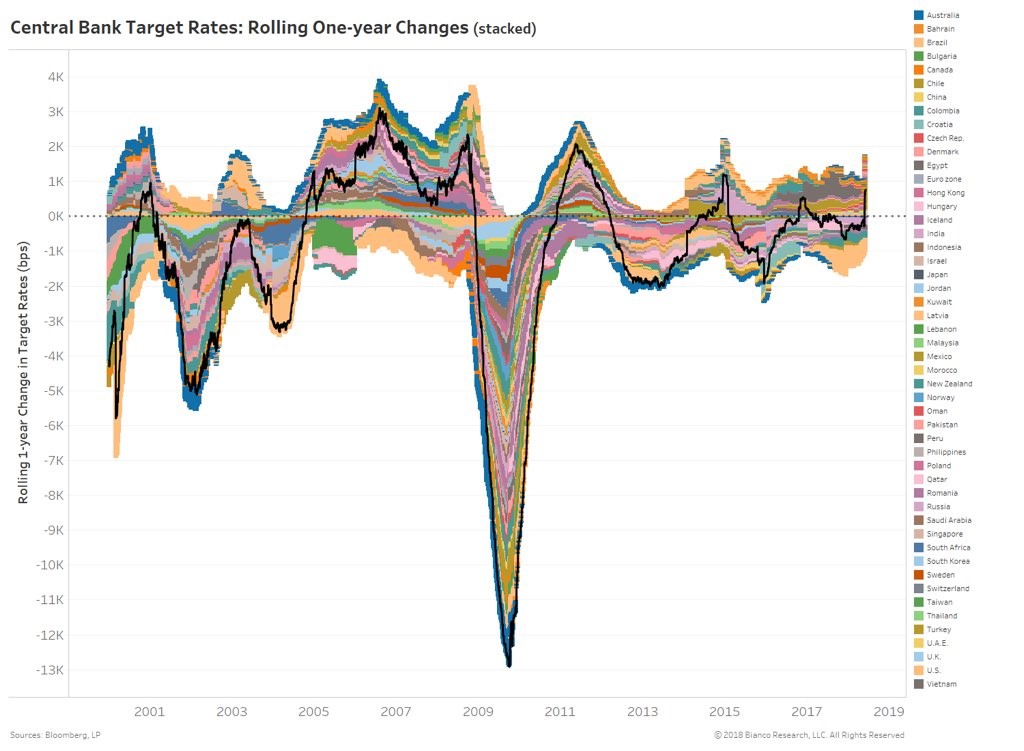
I often mentioned how the Fed is more hawkish than the other advanced economies. I am referring to the Fed’s balance sheet and interest rate policy compared to the ECB and the JCB. As you can see from the chart below, the year over year global central bank target rate has increased in the past few months to the third highest peak of this cycle.
This chart is obviously overkill because you can’t see each color since there are 50 countries included. Nevertheless, it’s interesting to see rates increase right as economic growth peaks. That would imply, after the rate increases a bit more in the next few months, there will be another slowdown like 2015-2016 in the next year or two.
The big worry is this slowdown won’t end as nicely as the previous two. In early 2016, there were serious fears of a recession. Those will grow in the next weak period because this has been a long cycle and the yield curve is flatter.
Hedonic Adjustments
I usually don’t talk about how inflation is calculated, but since it is the most important metric in the economy, you should understand how it works. One of the more contentious issues with inflation calculations from the government is hedonic adjustments.
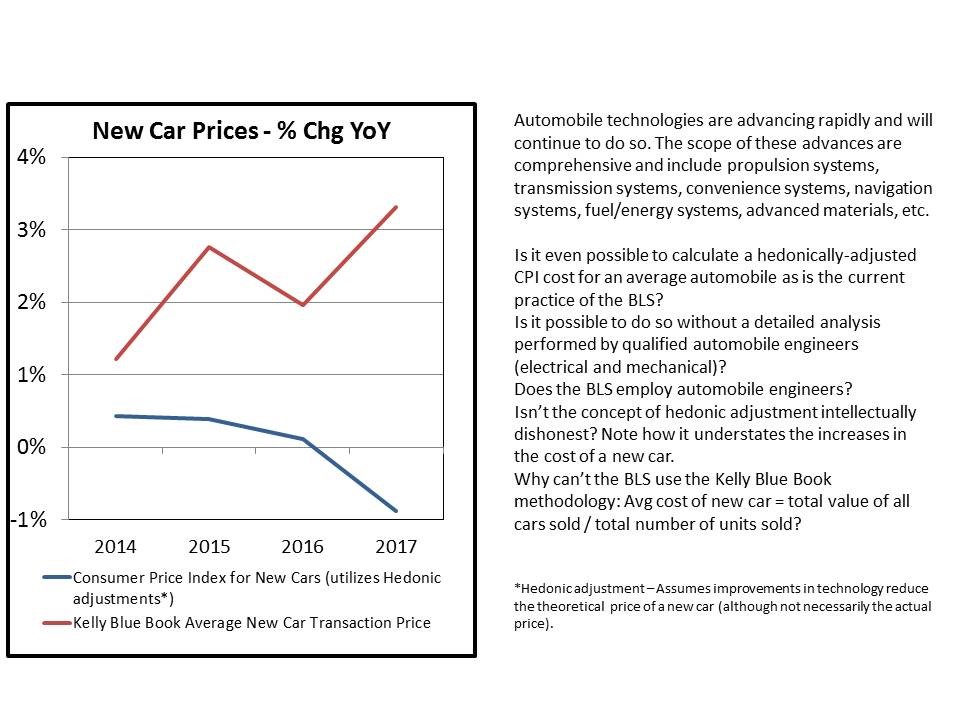
A hedonic adjustment is when the government adjusts the nominal price increase of a product lower by the amount the product improved. It’s easy to adjust for quantity by measuring the price increases on a per unit basis. It’s much more difficult to measure qualitative differences.
The question is how much more is a car with all-wheel drive worth than one without it? The obvious answer to that is the price each manufacturer charges, but that doesn’t help for hedonic adjustments because that just gets you back to the flat line. The theory of hedonic adjustments is sound because quality improvements are just like quantitative improvements. The tough part is measuring the differences.
The chart below shows the year over year change in car prices according to Kelly Blue Book’s average new car transaction price. As you can see, the increase is above 3% in 2017. On the other hand, the price actually fell in 2017 after the hedonic adjustment. That’s because the government feels quality increased more than price.
My challenge to the critics of hedonic adjustments is to come up with your own quality adjusted price change. The theory is sound. It’s possible to have a differing calculation.
The government gets flack for making this calculation, but unless the critics have a better answer, then they don’t have much of an argument. To be clear, the Fed always tinkers with how it measures inflation and how much inflation it’s okay with. Whenever a change is made to calculations, the Fed and government are always criticized. I will continue to look at all the inflation data I can find and then formulate a balanced opinion on where it is.
Don Kaufman is co-founder of TheoTrade.
View a brief video interview with Don Kaufman on volatility for traders and investors here
Recorded at TradersExpo New York Feb. 25, 2018
Duration: 2:34.
About MoneyShow.com: Founded in 1981, MoneyShow is a privately held financial media company headquartered in Sarasota, Florida. As a global network of investing and trading education, MoneyShow presents an extensive agenda of live and online events that attract over 75,000 investors, traders and financial advisors around the world.


