Although GBP/USD moved higher once again earlier today, currency bulls approached two very important resistances on their way to higher levels. Will they be strong enough to push the exchange rate above them?
EUR/USD
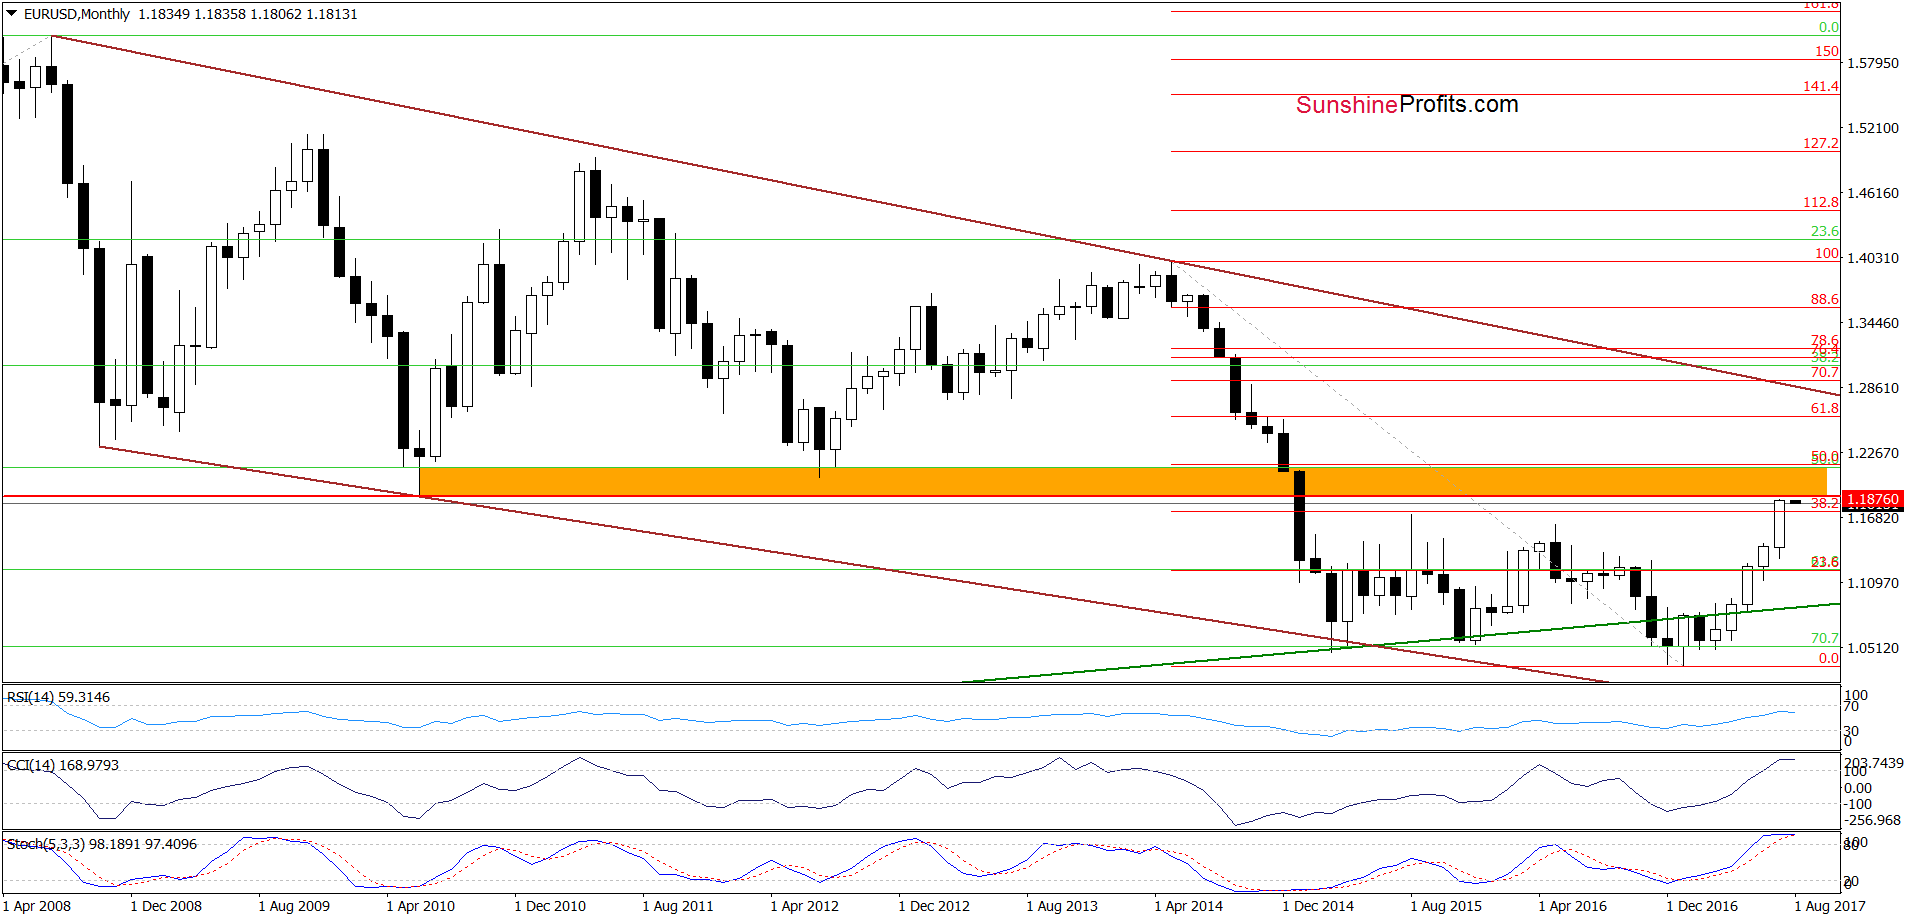
Yesterday, EUR/USD moved higher once again, which resulted in an increase to slightly below the orange resistance zone created by the June 2010 and July 2012 lows. In our opinion, this important resistance area together with the current position of the daily and even monthly indicators suggests that reversal and lower prices are just around the corner (please note that there are also bearish divergences between the exchange rate and the daily indicators, which increases the probability of reversal in the coming days).

Very short-term outlook: mixed with bearish bias
Short-term outlook: bearish
MT outlook: mixed
LT outlook: mixed
GBP/USD
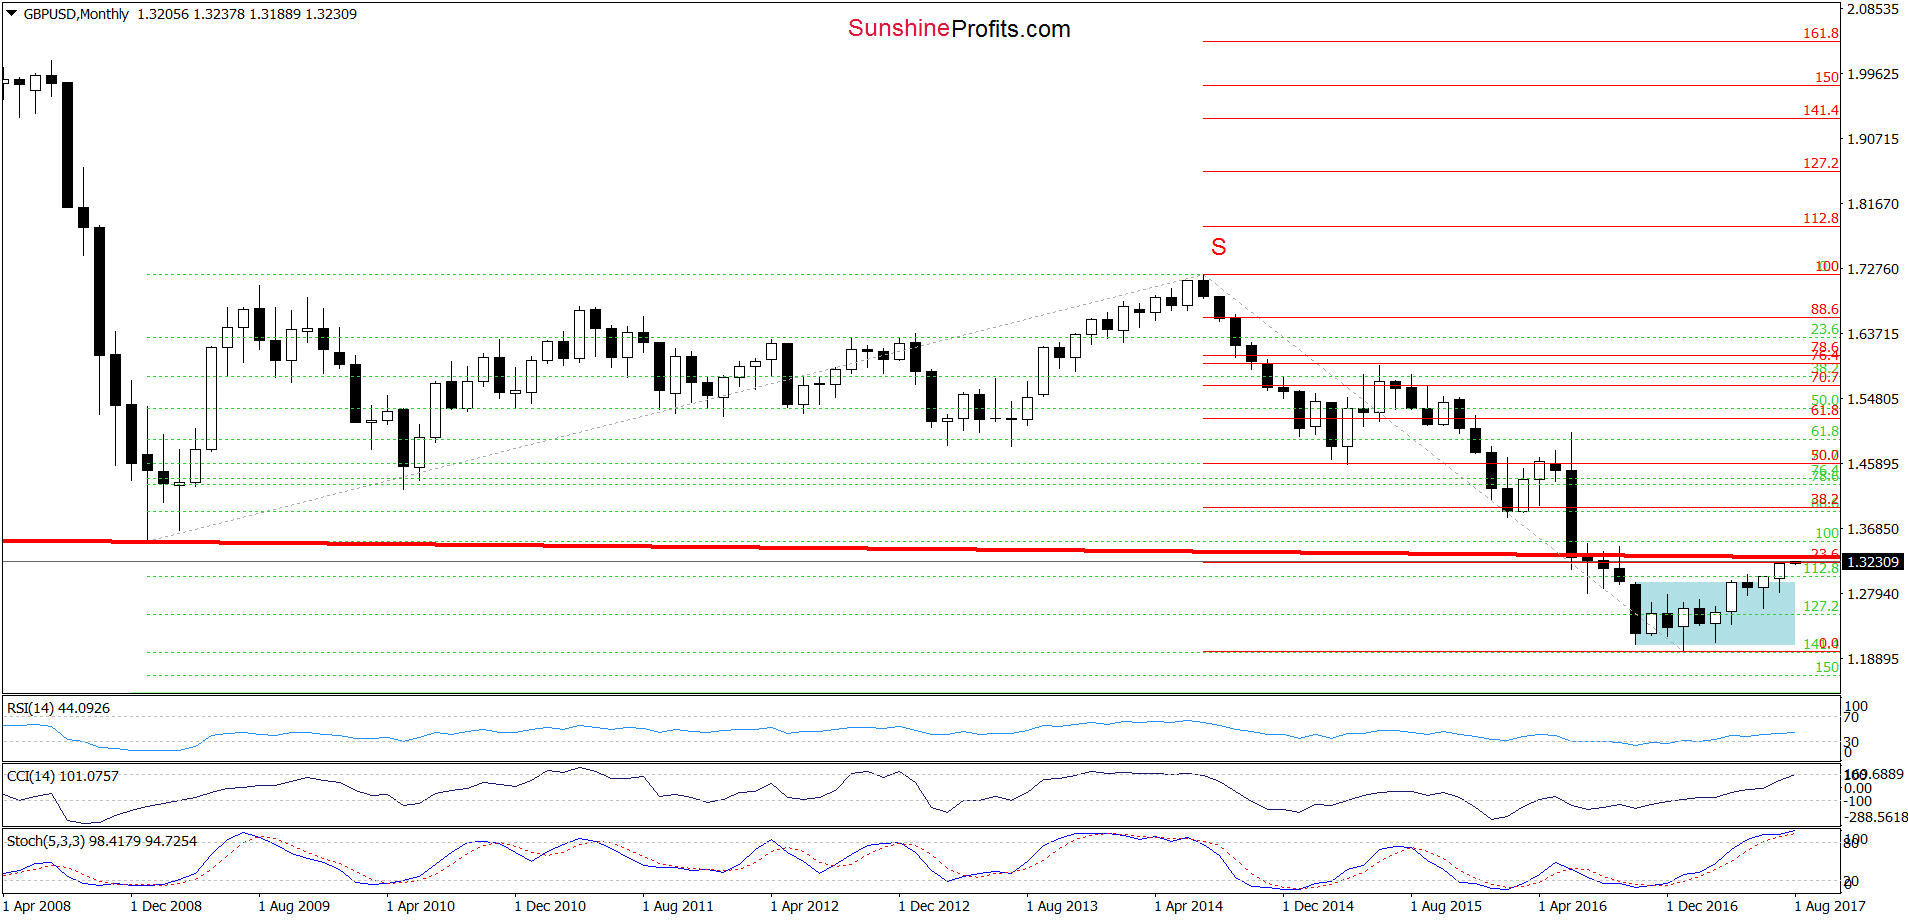
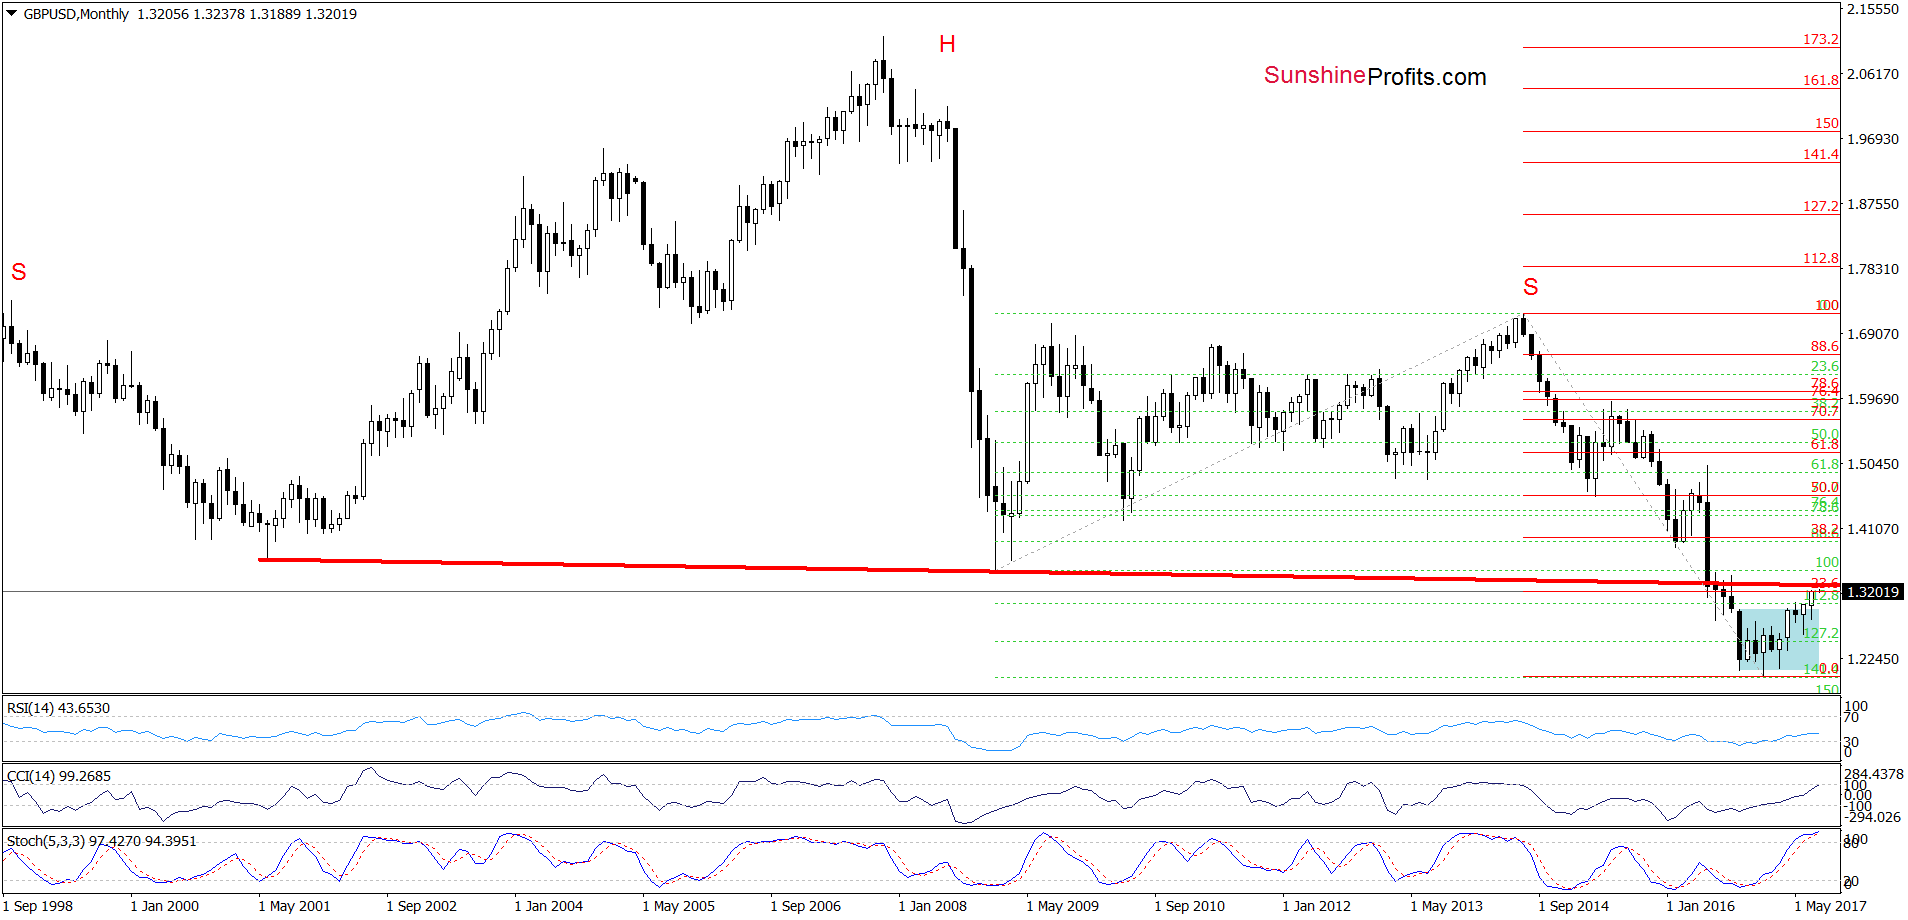
Yesterday, GBP/USD extended gains, which resulted in a fresh July peak. Thanks to the recent upward move the exchange rate approached two very important resistances – the neck line of the long-term head and shoulders formation (marked on the chart above) and the upper border of the brown rising wedge (seen on the chart below), which together increase significantly the probability of reversal and declines in the coming days (or even weeks).
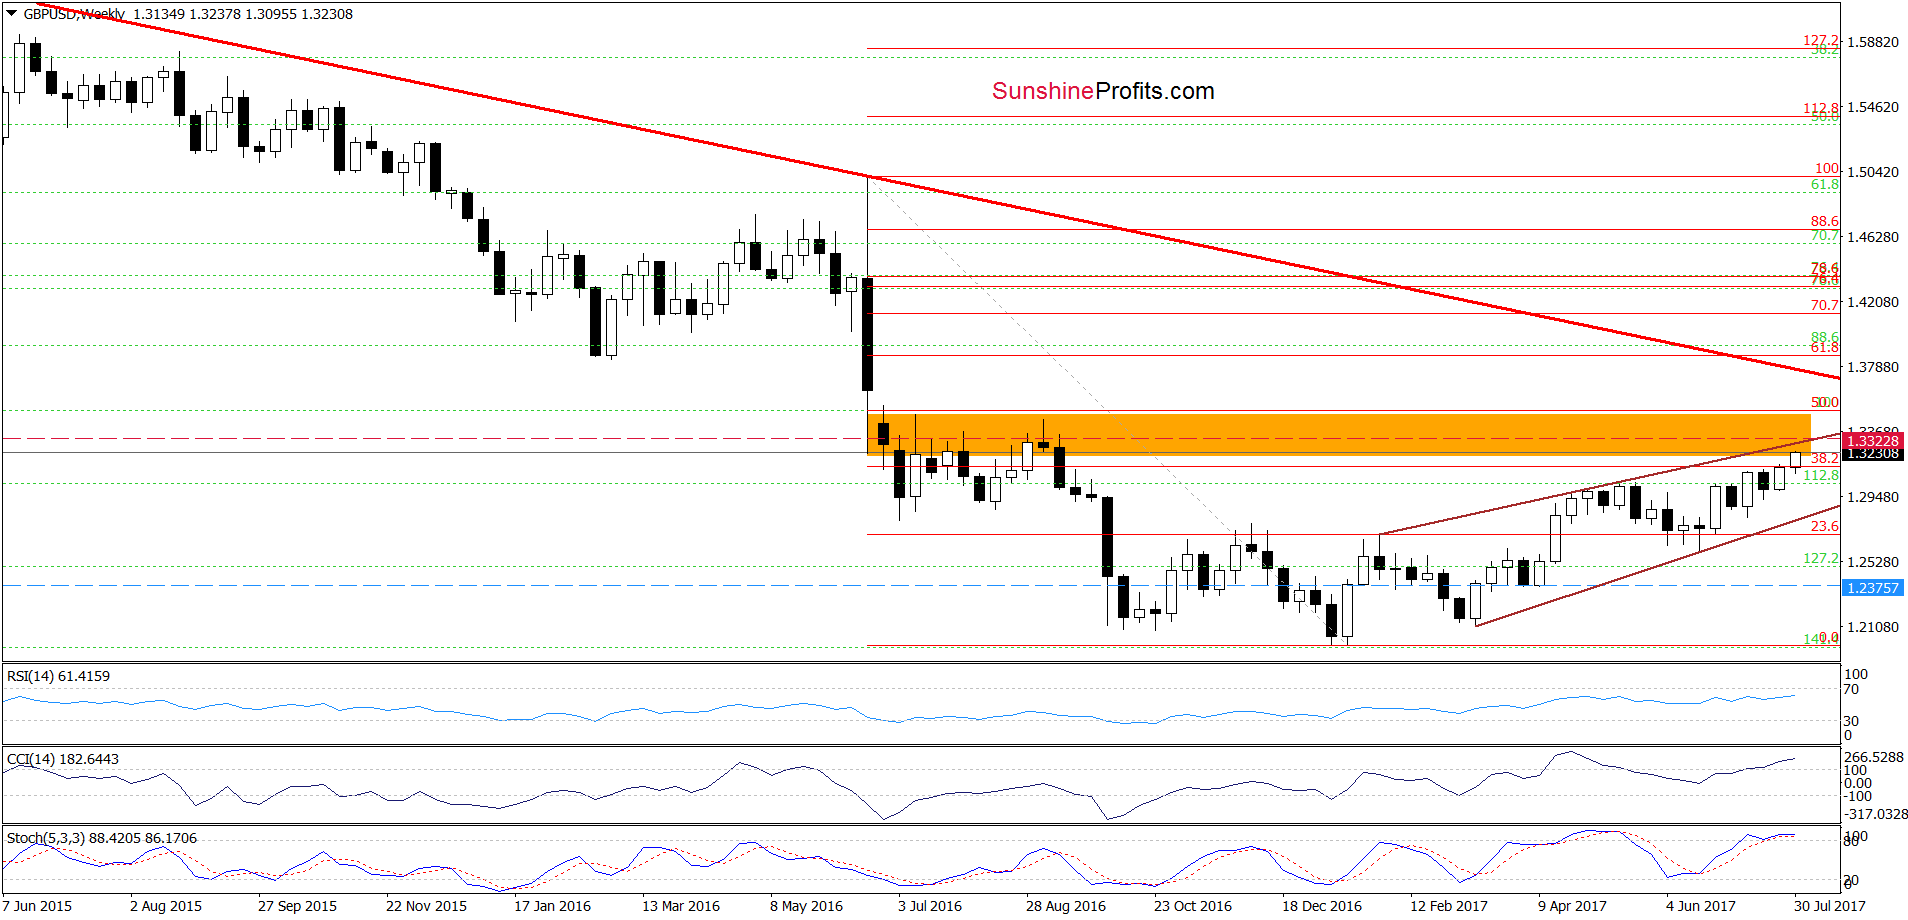
Why? Because if GBP/USD declines from current levels, we’ll likely see a verification of the breakdown under the neck line of the long-term head and shoulders formation, which should encourage currency bulls to act and result in a drop to (at least) the lower line of the brown rising wedge in the following weeks.
Very short-term outlook: bearish
Short-term outlook: mixed with bearish bias
MT outlook: mixed with bearish bias
LT outlook: mixed
AUD/USD
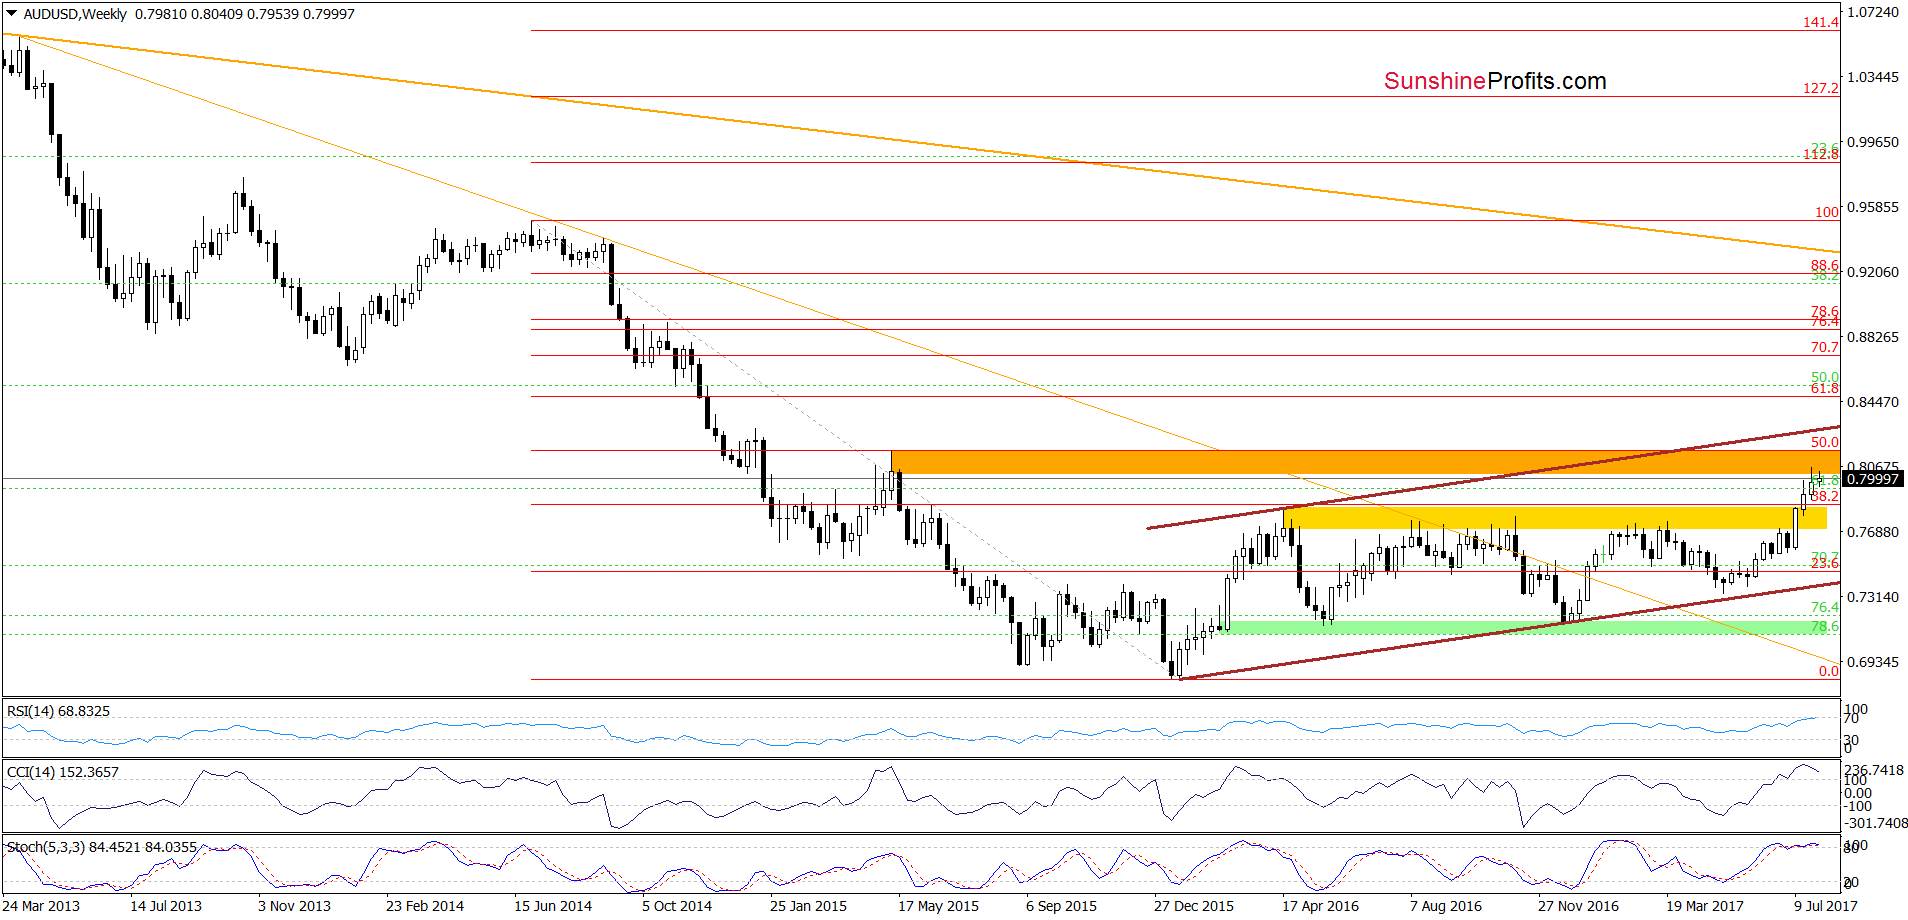
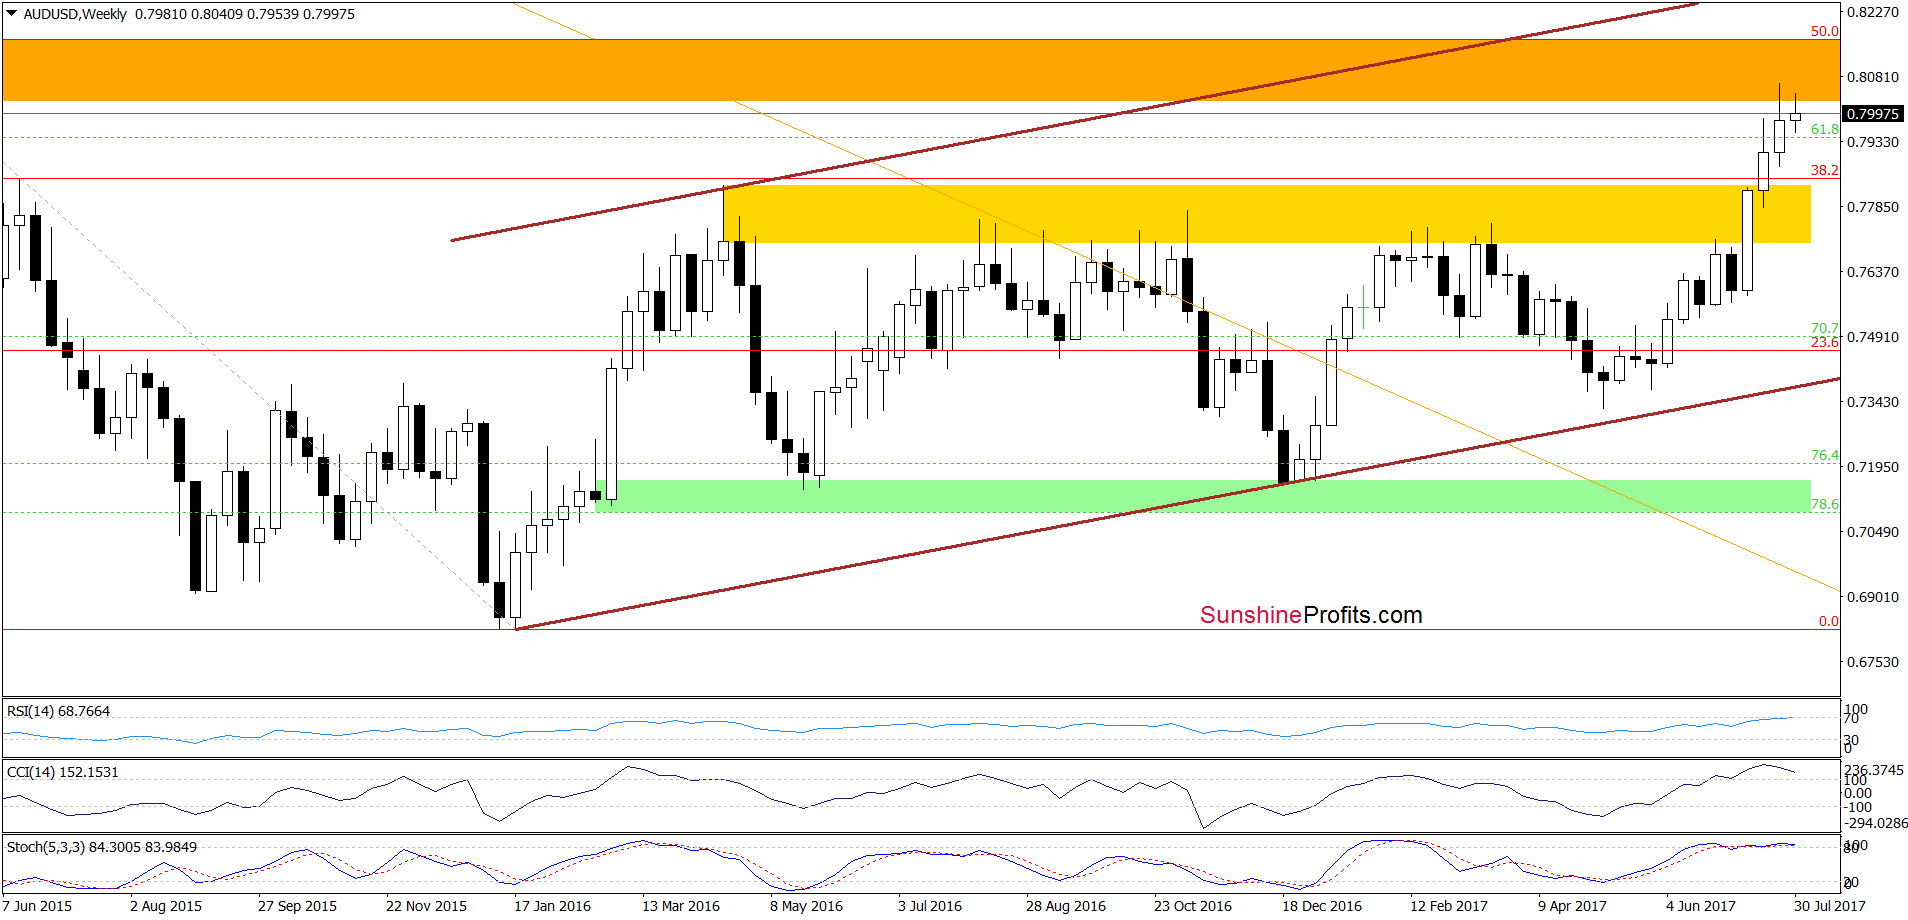
Looking at the weekly chart, we see that although AUD/USD moved higher earlier this week, the orange resistance zone (created by the 50% Fibonacci retracement and May 2015 highs) continues to keep gains in check. Therefore, even if the exchange increases once again, the space for another upswing seems limited as the upper line of the zone is not far from current levels.
Having said the above, let’s check the very short-term picture.
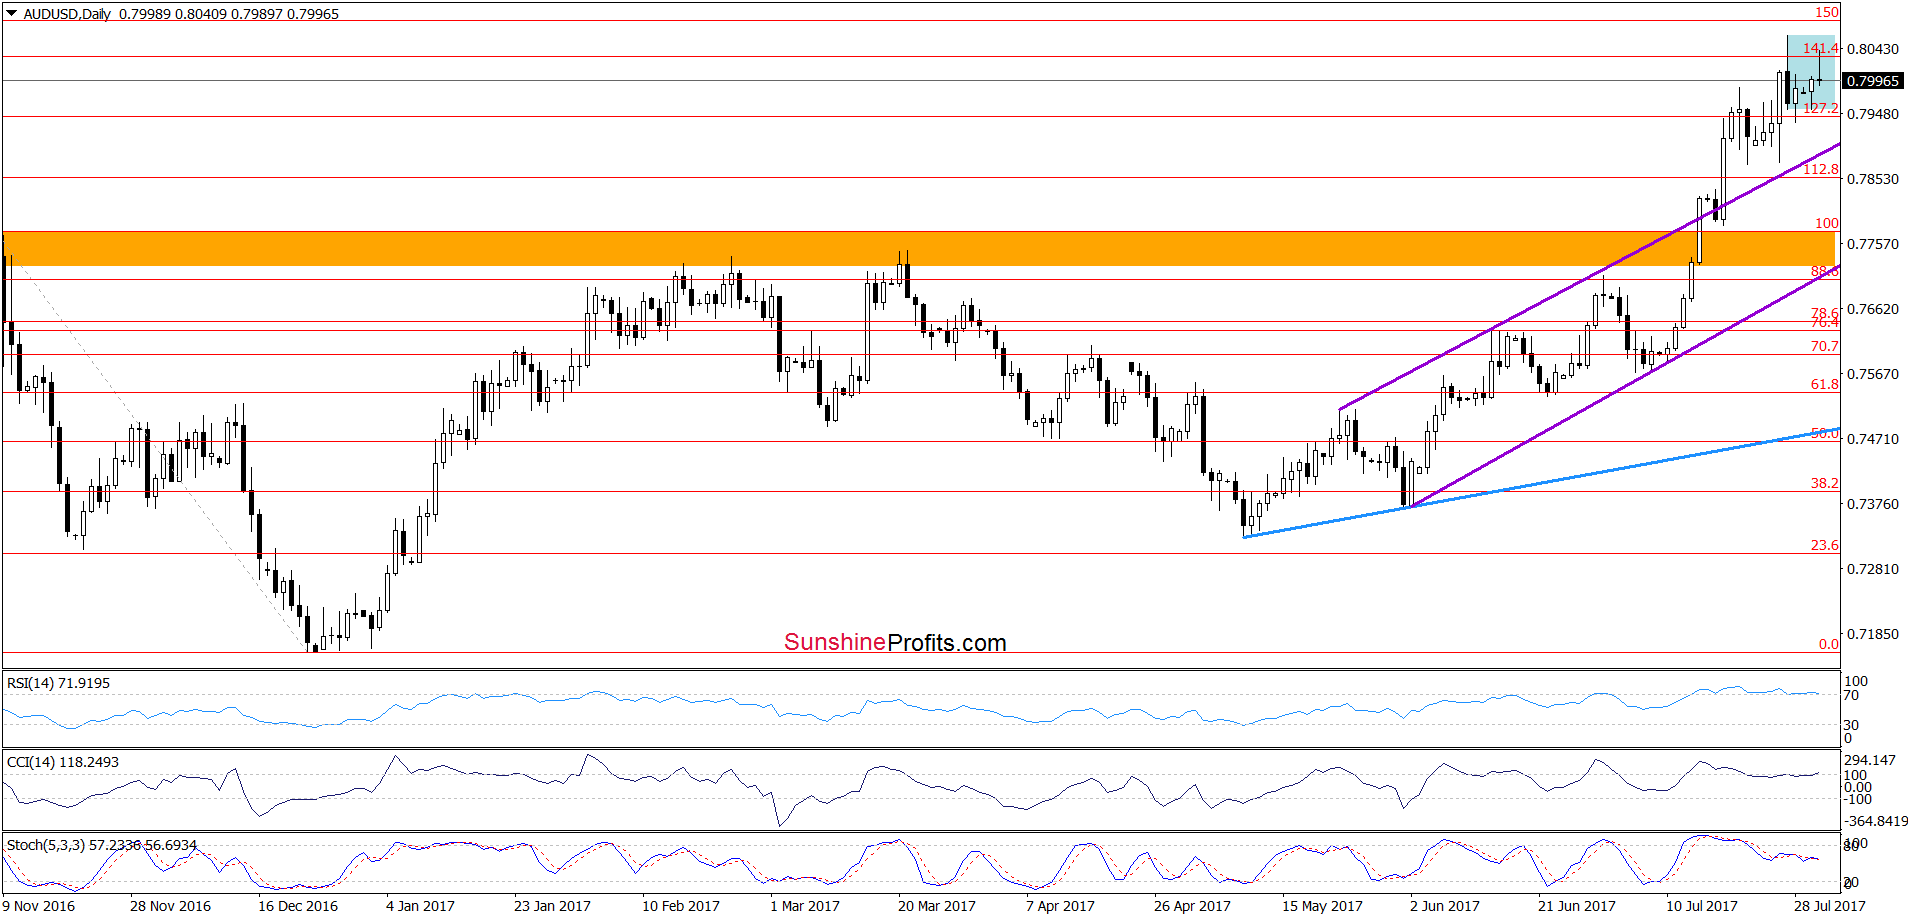
Earlier today, AUD/USD increased once again, but the upper border of the blue consolidation together with the 141.4% Fibonacci extension and the recent peak encouraged currency bears to act. As a result, the exchange rate erased some gains, but it is still trading in the consolidation, which makes the very short-term picture a bit unclear. So, what’s next for AUD/USD? The sell signals generated by the daily indicators and the current position of the weekly indicators suggest that reversal and bigger declines are just around the corner. Nevertheless, it seems to us that as long as there is no invalidation of the breakout above the upper line of the trend channel an acceleration of decline is not likely to be seen. Therefore, waiting at the sidelines for more valuable clues about future moves is justified from the risk/reward perspective.
Very short-term outlook: mixed with bearish bias
Short-term outlook: mixed with bearish bias
MT outlook: mixed
LT outlook: mixed
Naturally, the above could change in the coming days and we’ll keep our subscribers informed, but that’s what appears likely based on the data that we have right now. If you enjoyed reading our analysis, we encourage you to subscribe to our daily Forex Trading Alerts.
Thank you.
Nadia Simmons
Forex & Oil Trading Strategist
Przemyslaw Radomski, CFA
Founder, Editor-in-chief, Gold & Silver Fund Manager
Gold & Silver Trading Alerts
Forex Trading Alerts
Oil Investment Updates
Oil Trading Alerts


