GBP/USD is trading around 1.2500, awaiting news related to the political future of PM Theresa May. What do the charts say about the next moves?
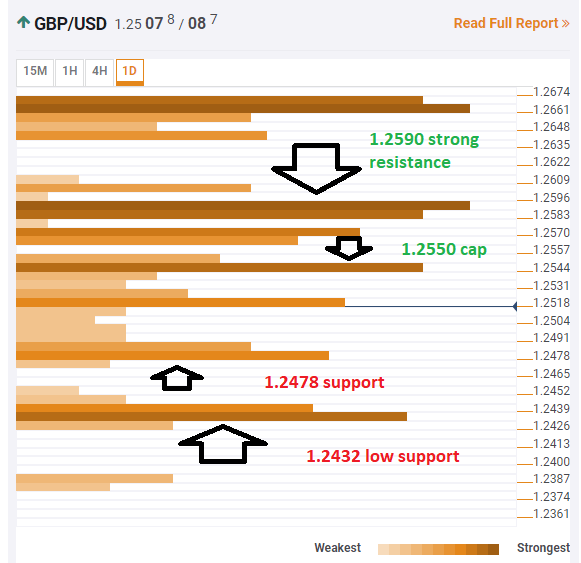
The Technical Confluences Indicator shows that cable faces some resistance around 1.2550, where we see the convergence of the Simple Moving Average 100-15m, the SMA 10-4h, and the potent Fibonacci 38.2% one-day.
A move to the upside would be difficult, with several clusters of resistance limiting the movement. The most significant barrier is around 1.2590 where we see the confluence of the SMA 50-1h, the Fibonacci 61.8% one-day, the SMA 200-15m, and the powerful Pivot Point one-month Support 1.
On the downside, we see some feeble support at around 1.2478 which is the meeting point of the PP one-month Support 3 and previous daily low.
Significant support awaits only at 1.2432 where we see the PP one-month S2, the Bollinger Band 4h-Lower, and the PP one-day S1 converge.

All in all, resistance is more substantial than support for the GBP/USD currency pair.
This is how it looks on the tool:
Confluence Detector
The Confluence Detector finds exciting opportunities using Technical Confluences. The TC is a tool to locate and point out those price levels where there is a congestion of indicators, moving averages, Fibonacci levels, Pivot Points, etc. Knowing where these congestion points are located is very useful for the trader, and can be used as a basis for different strategies.
This tool assigns a certain amount of “weight” to each indicator, and this “weight” can influence adjacents price levels. This means that one price level without any indicator or moving average but under the influence of two “strongly weighted” levels accumulate more resistance than their neighbors. In these cases, the tool signals resistance in apparently empty areas.


