GBP/USD after UK Jobs Report
Earlier today, the latest UK jobs report showed that the unemployment rate dropped to the lowest since 1975, which pushed the British pound higher against the greenback. Despite this improvement, currency bulls didn’t manage to hold gained levels, which resulted in a pullback. How low could GBP/USD go in the coming days?
EUR/USD
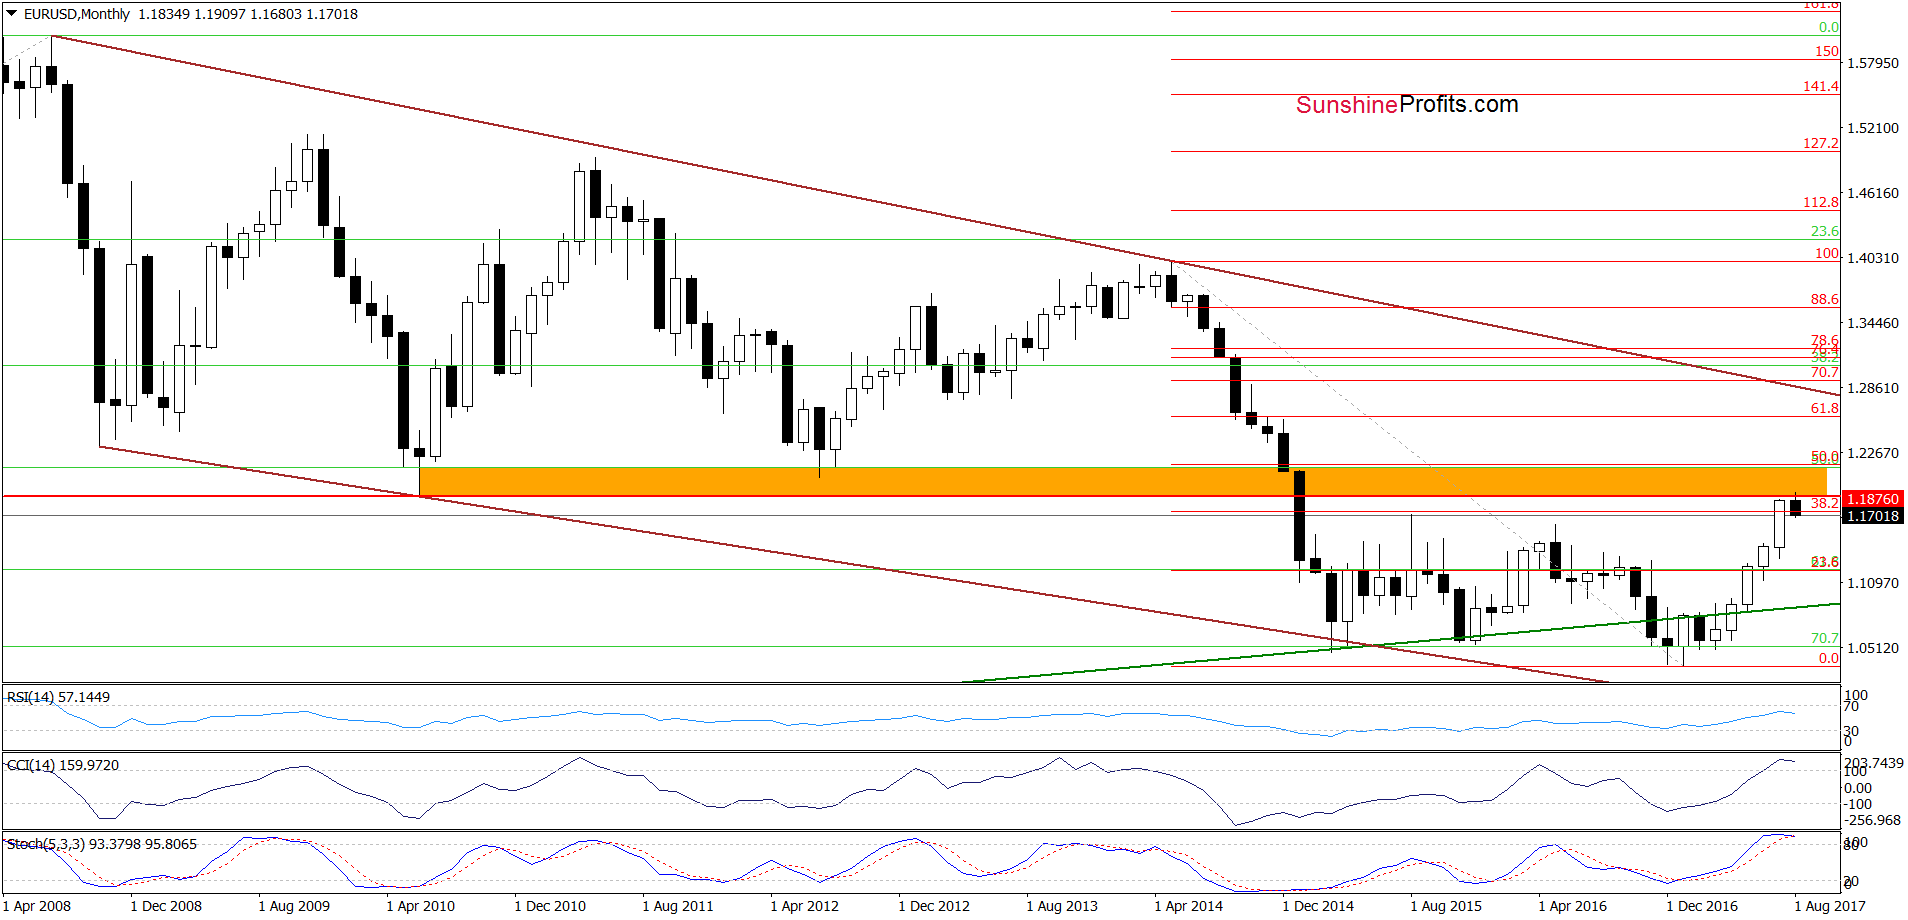

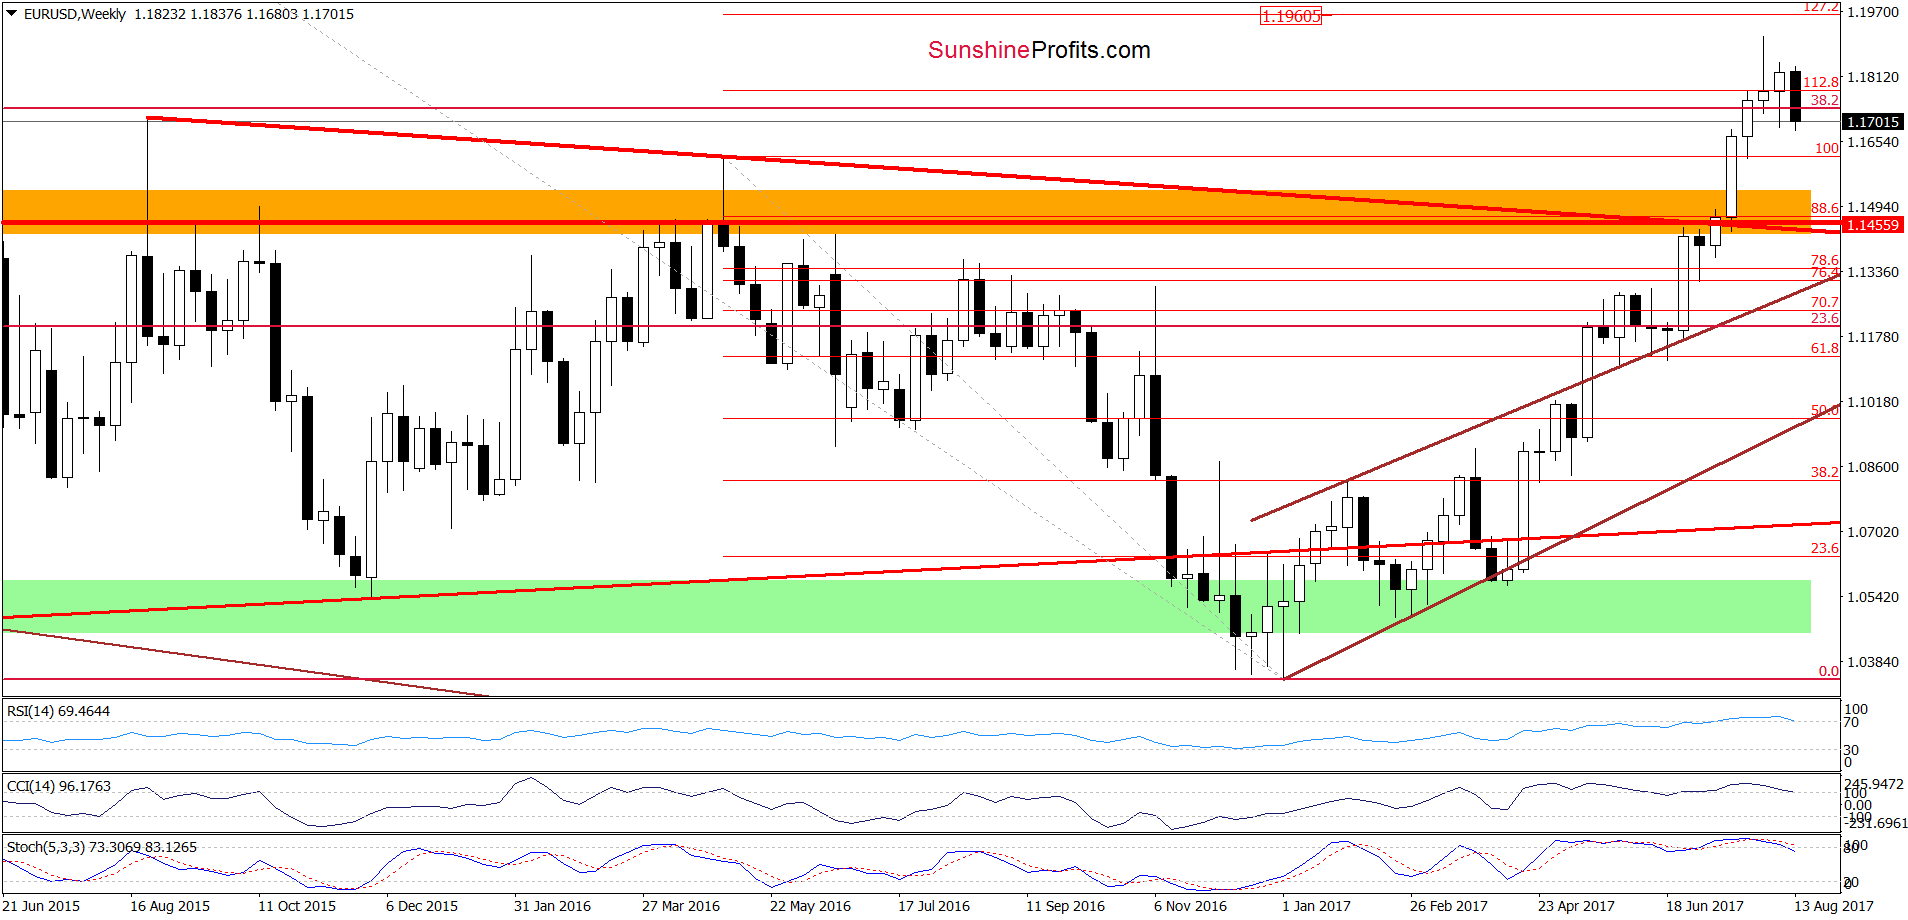
Looking at the charts, we see that EUR/USD moved sharply lower and slipped below the previously-broken 38.2% Fibonacci retracement and the 112.8% Fibonacci extension. In this way, the pair invalidated the earlier breakout, which is a negative development. Nevertheless, in our opinion, this event will turn into bearish only if we see a weekly closure below these levels. Until this time another rebound (similar to what we saw in the previous week) can’t be ruled out.
Very short-term outlook: mixed
Short-term outlook: mixed with bearish bias
MT outlook: mixed
LT outlook: mixed
GBP/USD
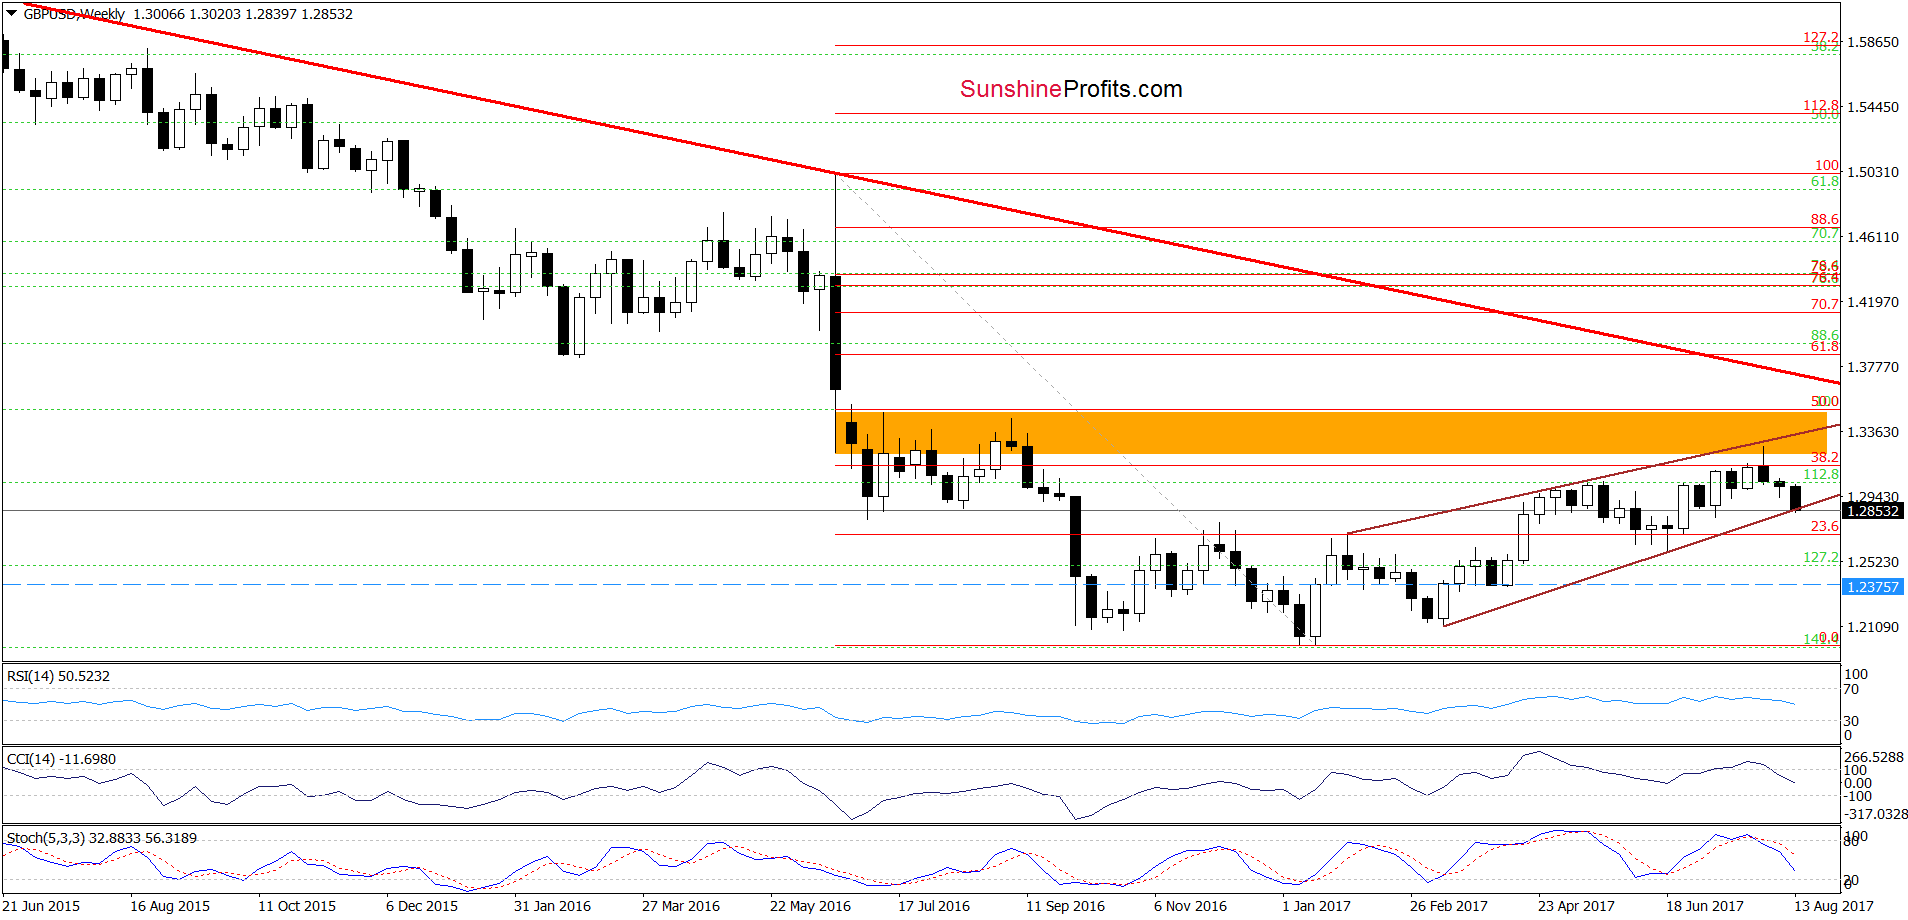
Looking at the medium-term chart, we see that GBP/USD slipped to the lower border of the brown rising trend channel, which could encourage currency bulls to act.
But will we see such price action? In our opinion, it’s quite doubtful, because even if the exchange rate rebounds slightly from current levels, we should keep in mind all bearish technical factors. Firstly, the sell signals generated by the weekly indicators remain in place, supporting currency bears and further declines. Secondly, when we take a closer look at the daily chart below, we see that the sell signals generated by the daily indicators also support lower values of GBP/USD.
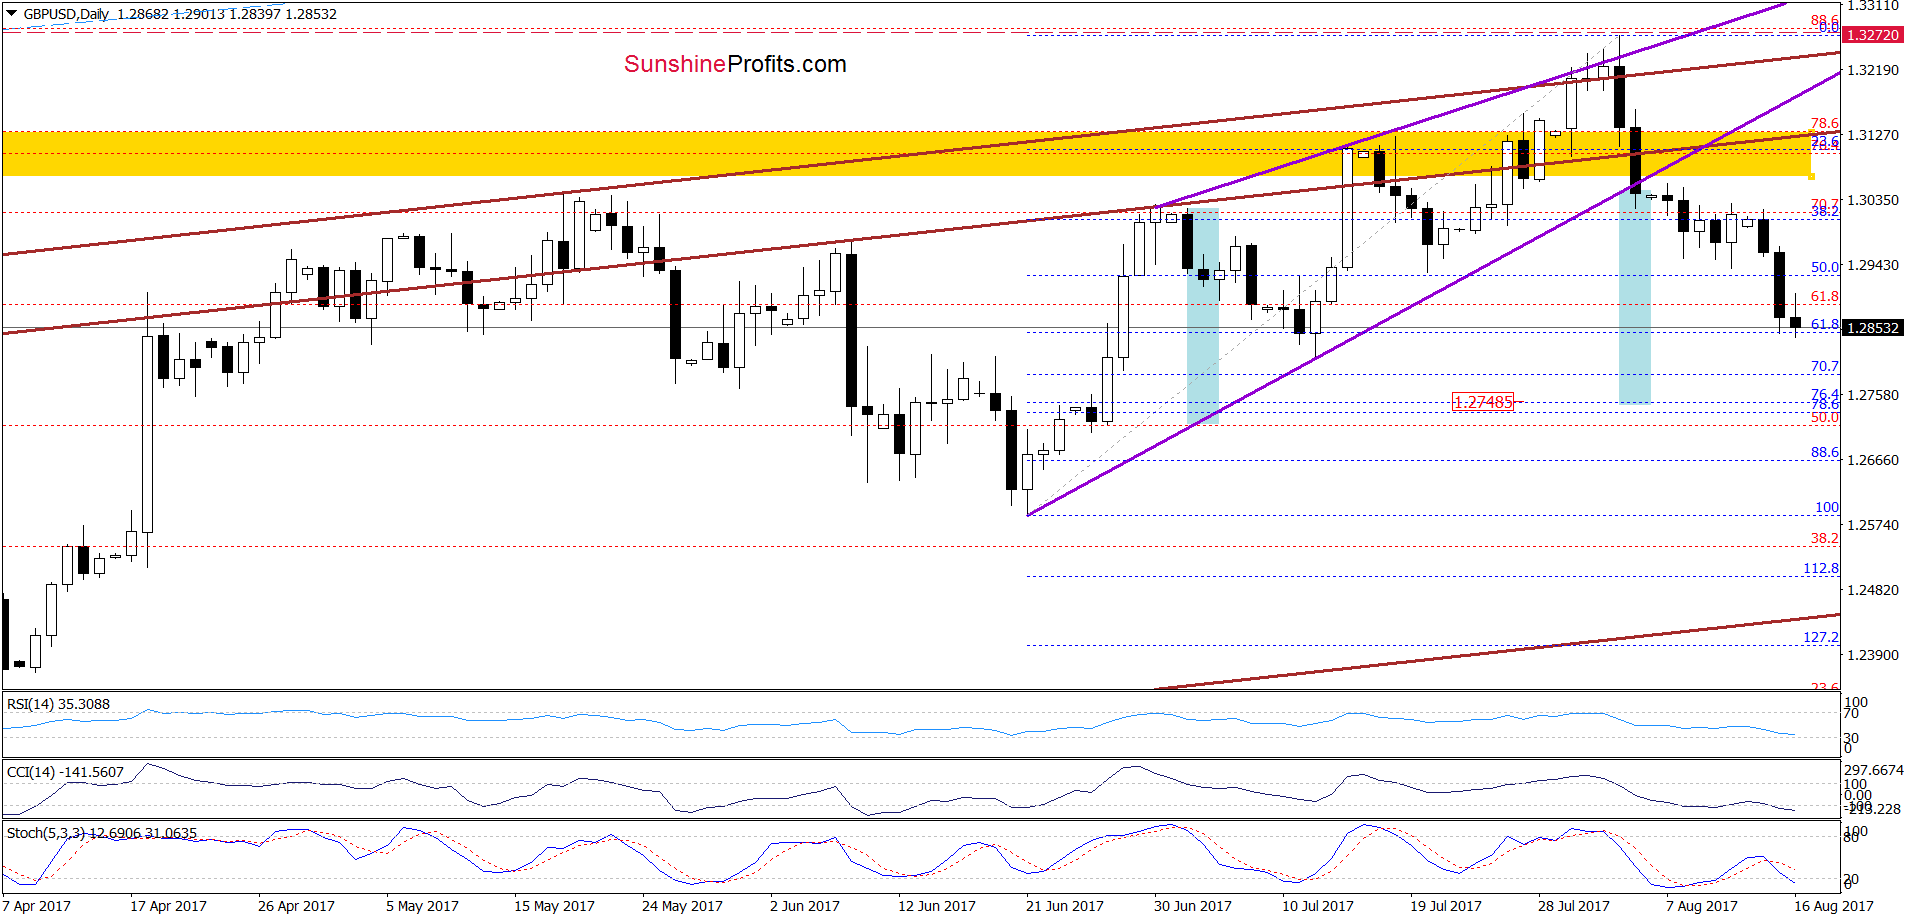
Thirdly, the pair moved sharply lower (making our short positions even more profitable) and broke below the 50% Fibonacci retracement yesterday, which resulted in a slip slightly below the 61.8% retracement. Fourthly, GBP/USD remains well below the yellow resistance zone and the lower border of the purple rising wedge. All the above-mentioned negative factors increase the probability that we’ll see a realization of the bearish scenario from our Forex Trading Alert posted on August 7, 2017:
(….) if GBP/USD extends declines from current levels, we’ll see a drop to (at least) 1.2748, where the size of the downward move will correspond to the height of the rising wedge and where the 76.4% and 78.6% Fibonacci retracements are.
Very short-term outlook: bearish
Short-term outlook: mixed with bearish bias
MT outlook: mixed with bearish bias
LT outlook: mixed
USD/JPY
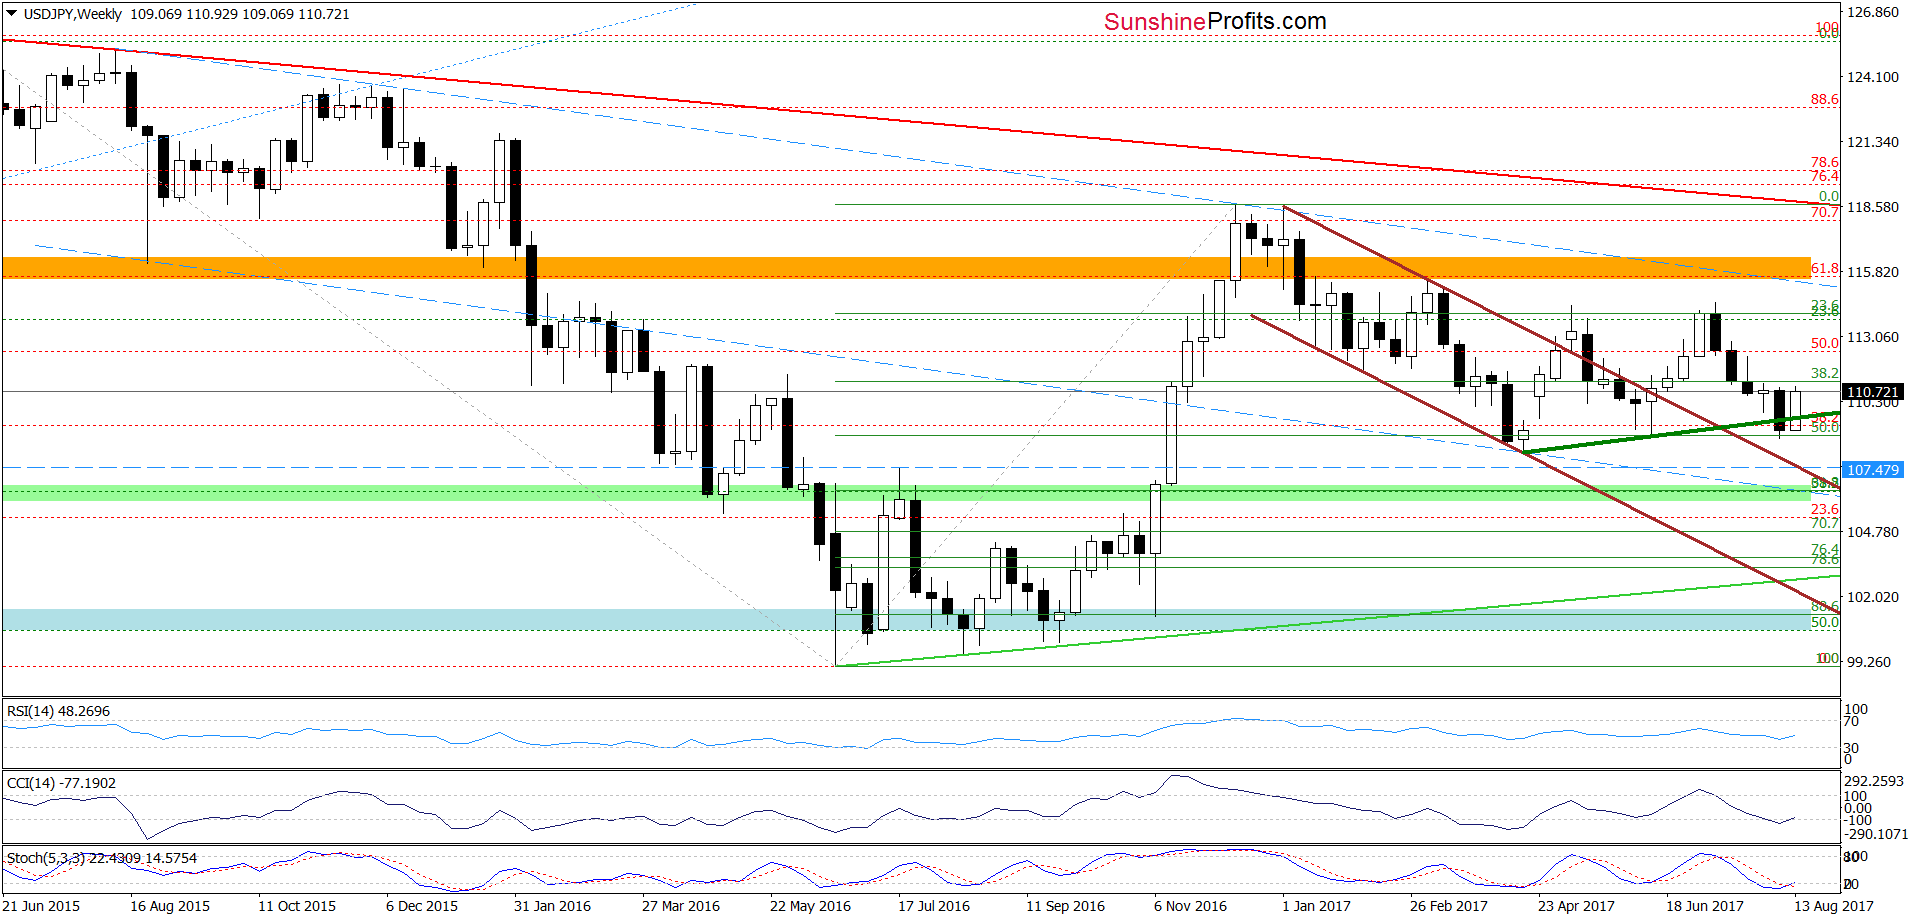
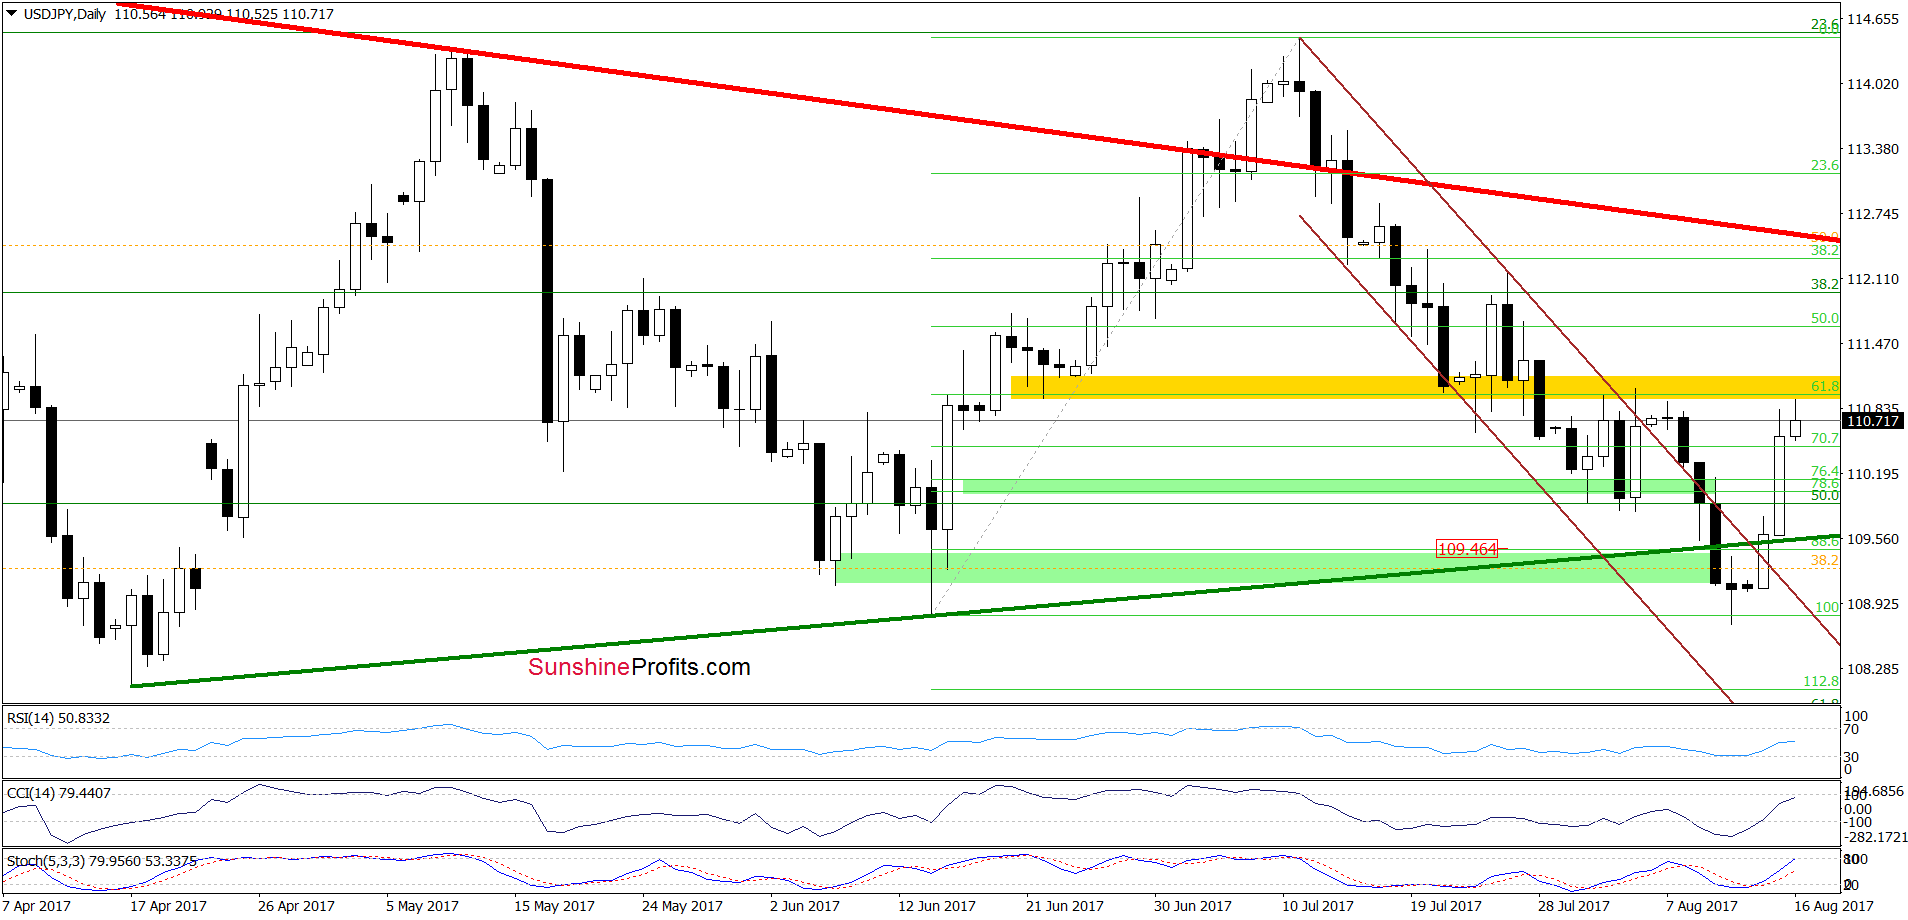
The first thing that catches the eye on the above charts is an invalidation of the breakdown under the medium-term green support line based on the previous lows. This positive event encouraged currency bulls to act, which resulted in a breakout above the upper border of the brown declining trend channel and a climb to the yellow resistance zone. As you see on the daily chart, this area stopped increases two times in the previous month, which suggests that as long as there is no breakout above the yellow zone another bigger move to the upside is not reliable enough to open long positions. As always, we’ll keep you – our subscribers – informed should anything change.
Very short-term outlook: mixed
Short-term outlook: mixed
MT outlook: mixed
LT outlook: mixed
Naturally, the above could change in the coming days and we’ll keep our subscribers informed, but that’s what appears likely based on the data that we have right now. If you enjoyed reading our analysis, we encourage you to subscribe to our daily Forex Trading Alerts.
Thank you.
Nadia Simmons
Forex & Oil Trading Strategist
Przemyslaw Radomski, CFA
Founder, Editor-in-chief, Gold & Silver Fund Manager
Gold & Silver Trading Alerts
Forex Trading Alerts
Oil Investment Updates
Oil Trading Alerts


