Actionable insights straight to your inbox

Equities logo

Further Rally Expected in VanEck Vectors Semiconductor ETF (SMH)

VanEck Vectors Semiconductor ETF (SMH) tracks a market-cap-weighted index of US-listed semiconductor companies.
ElliottWave-Forecast has built our reputation on accurate technical analysis and a winning attitude. By successfully incorporating the Elliott Wave Theory with Market Correlation, Cycles, Swing sequences, Distribution system and the Right Side system which consists of Right Side tags to inform clients of what side of the market should be traded and blue boxes to show areas for buying / selling. We provide precise forecasts with up-to-date analysis for 78 instruments including Forex, Commodities, ZN (10 year note yields), World Indices, Stocks, ETFs and Bitcoin.

VanEck Vectors Semiconductor ETF SMH tracks a market cap-weighted index of US-listed semiconductor companies. Such companies include big technology names like Intel INTC and Nvidia NVDA. The ETF is currently up +30% year-to-date making new all time highs and leading the move among related instruments.

For this article, we’ll be taking a look at the technical weekly and 4 hour charts of SMH based and applying Elliott wave theory :

SMH Weekly Chart

SMH Weekly Chart 4.30.2019

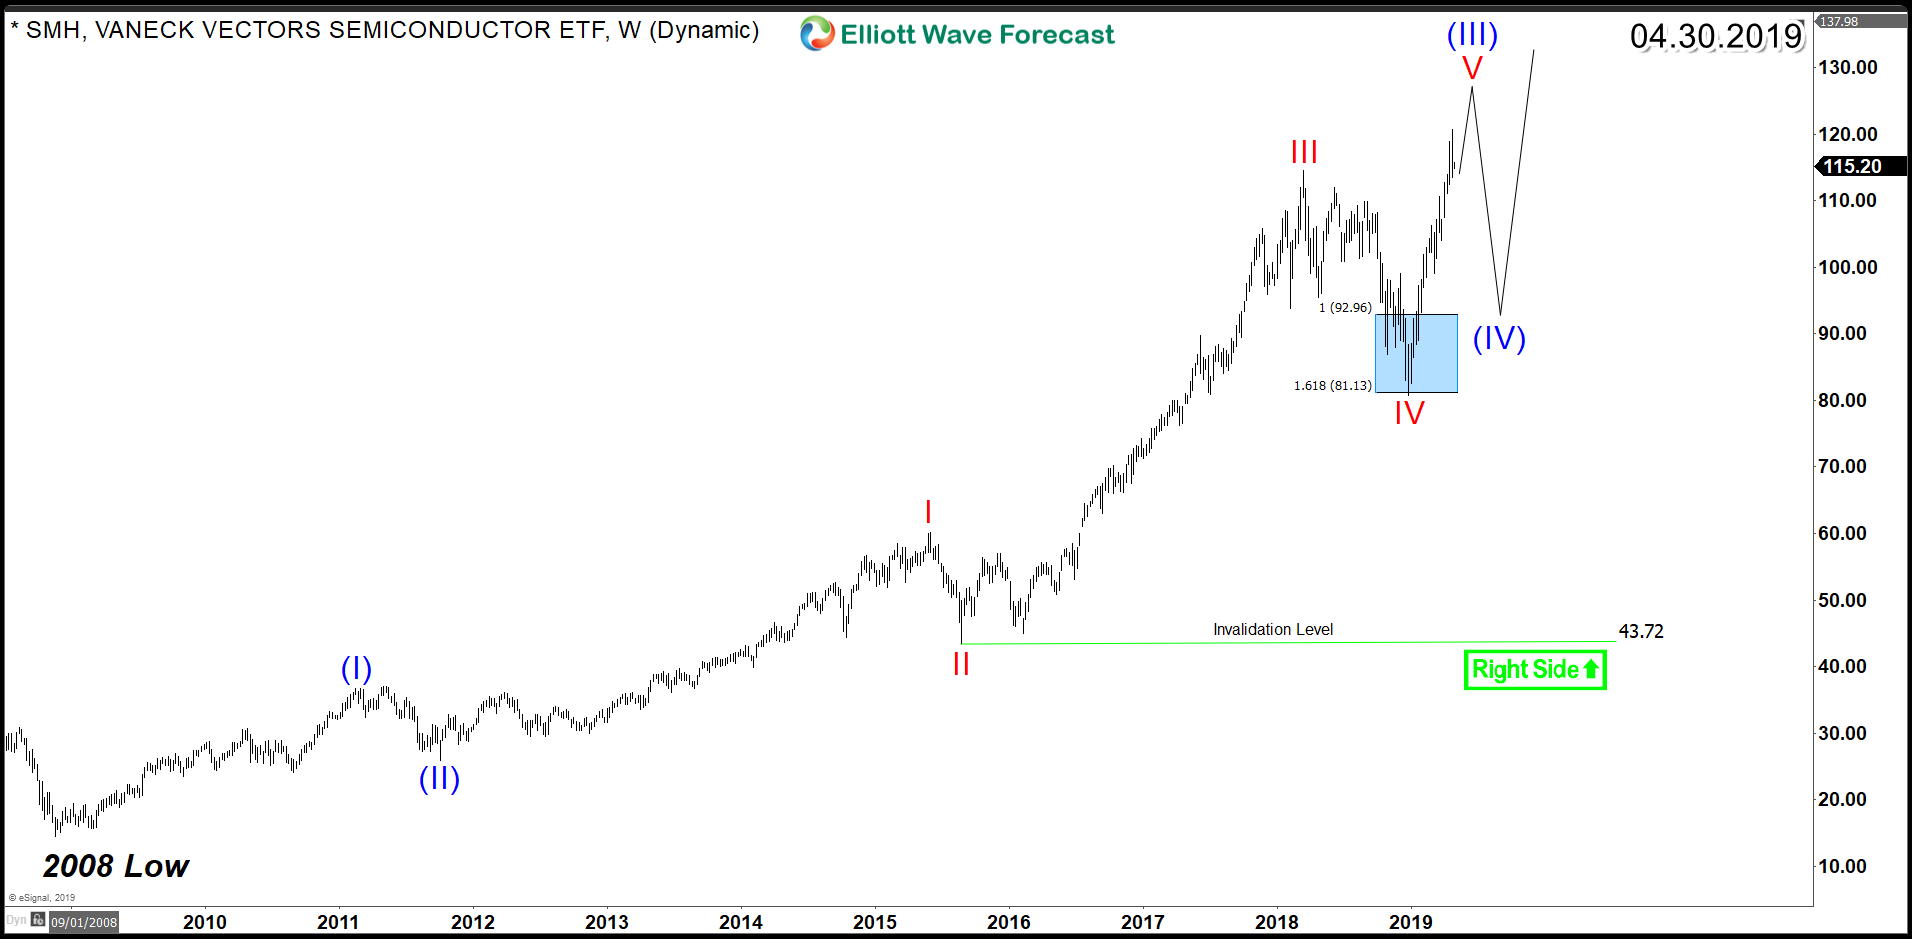
As you can see in the above chart, the current main cycle for SMH started in 2008 after the financial crisis. Up from there, it rallied higher in a series of Motive or Impulse waves which subdivide into 5 waves in lesser degree cycles of each leg.

The current wave V of (III) presented above is looking ideally for a target at the $124 – $140 area before another 3 waves correction similar to last year would take place in wave (IV) before the ETF will again resume the rally to new all time highs.

SMH 4H Chart

SMH 4H Chart 4.30.2019

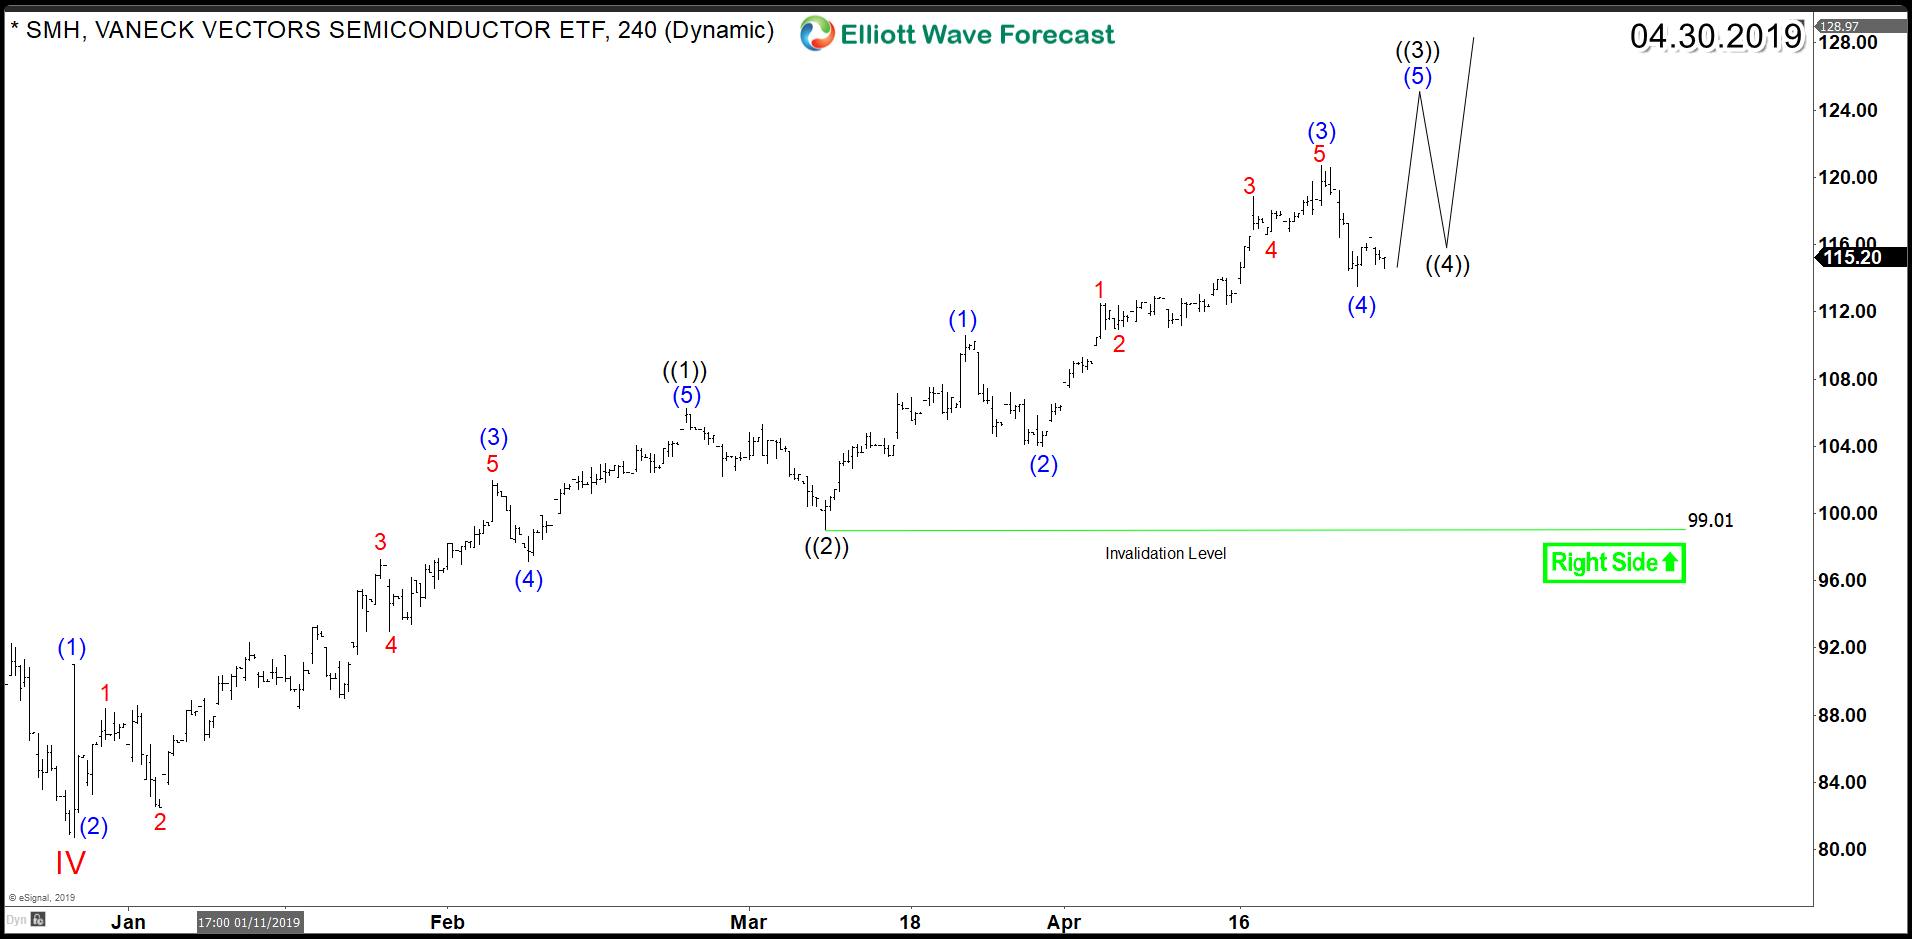
Using the 4 Hour chart, we can clearly see the 5 waves subdivision of the lesser degree cycles coming up from the December 2018 low. Up from there, the ETF is showing a bullish sequence higher which is aiming for a target at the 100% – $161.8% Fibonacci extension area of $124 – $140. Consequently, the short term pullback will be expected to remain supported above the $99 low for the ETF to extend further to the upside.

AT&T, T-Mobile and Verizon should be turning the volume up. Their current quiet murmur is just not enough.