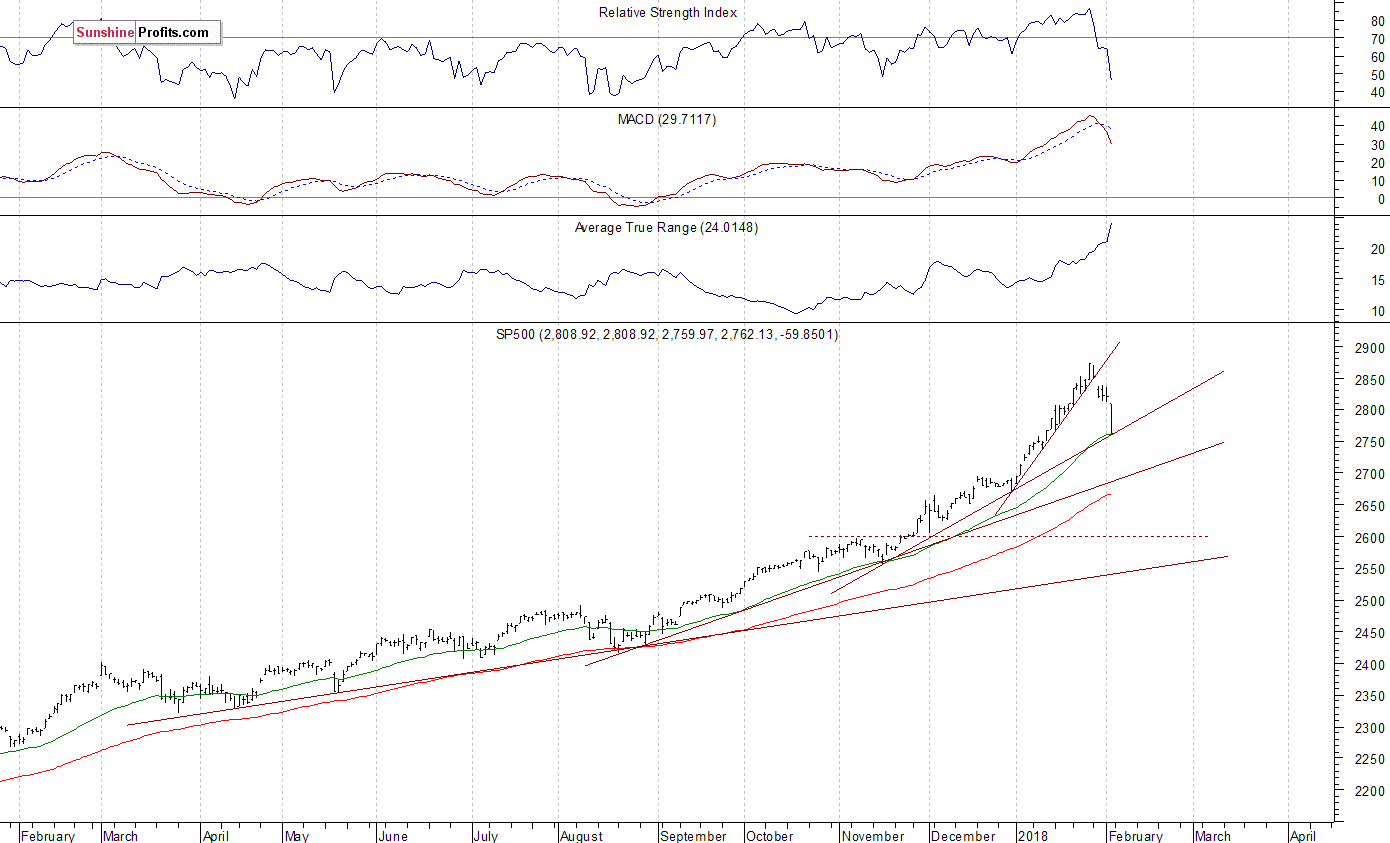
The main U.S. stock market indexes lost 2.0-2.5% on Friday, breaking below their three-day-long consolidation as investors reacted to quarterly corporate earnings, economic data releases, among others. The S&P 500 index accelerated its short-term downtrend following breakout below the level of 2,800. It currently trades 3.9% below its January 26 record high of 2,872.87. The broad stock market retraced more than 50% of its month-long rally off the December 29th local low at 2,673.61. The Dow Jones Industrial Average was relatively weaker, as it lost 2.5% on Friday, and the technology Nasdaq Composite fell 2.0%.
The nearest important level of support of the S&P 500 index is at around 2,750, marked by the January 11 daily gap up of 2,750.80-2,752.78. There is also an important Fibonacci retracement of 61.8% of the month-long rally at the level of 2,749.73. The next potential support level is at 2,720-2,740, marked by some previous consolidation. On the other hand, resistance level is now at 2,780-2,800, marked by previous level of support. The resistance level is also at around 2,835, marked by last week’s local highs.
There is a pretty big chance that the index reached some major medium-term high on Friday a week ago. It broke below its month-long upward trend line on Tuesday following gap-down opening of the trading session, confirming reversal of the uptrend. Will it retrace all of its January rally or even continue lower? The index is at its three-month-long upward trend line. For now, it looks like a downward correction:

Negative Expectations Again
The index futures contracts trade 0.8-1.2% lower vs. their Friday’s closing prices this morning. So, investors’ expectations before the opening of today’s trading session are very negative again. The European stock market indexes have lost 1.0-1.4% so far. Investors will wait for the ISM Non-Manufacturing PMI number release at 10:00 a.m. The market expects that it was at 56.5 in January. However, this data release probably won’t affect the overall negative market sentiment today. Investors will also wait for more quarterly corporate earnings announcements.
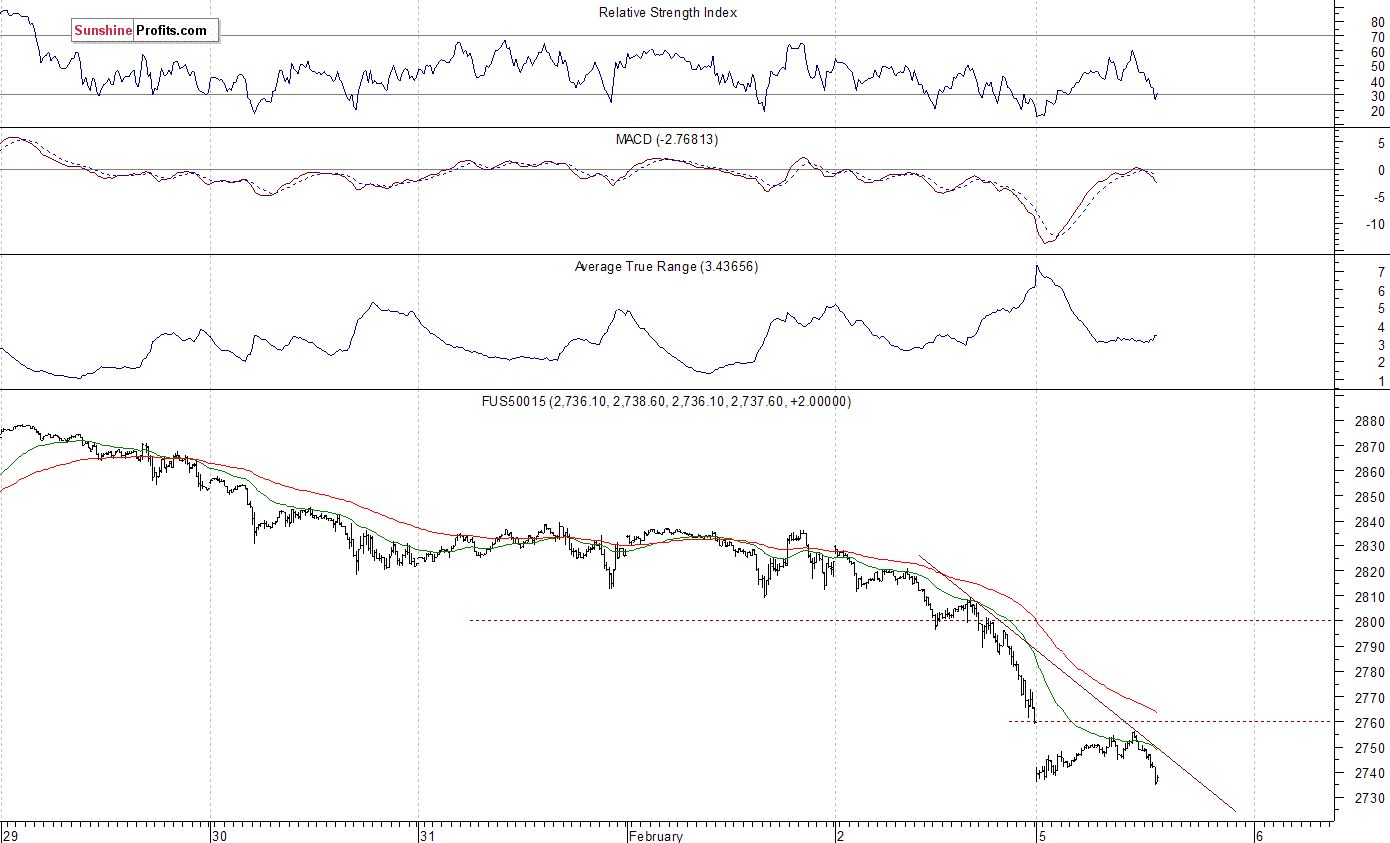
The S&P 500 futures contract trades within an intraday consolidation, as it fluctuates following an overnight move down. The market remains close to its local lows, well below its Friday’s panic end-of day-lows. It continues its short-term downtrend, as it retraces more of January move up. The nearest important level of resistance is at around 2,760, marked by an overnight gap down and Friday’s daily low. The next level of resistance is at 2,780-2,800, among others. On the other hand, support level is at 2,730-2,740, marked by short-term local lows. The next level of support is at 2,700-2.720. The futures contract is well below its Friday’s session lows, as the 15-minute chart shows:
Nasdaq At New Lows
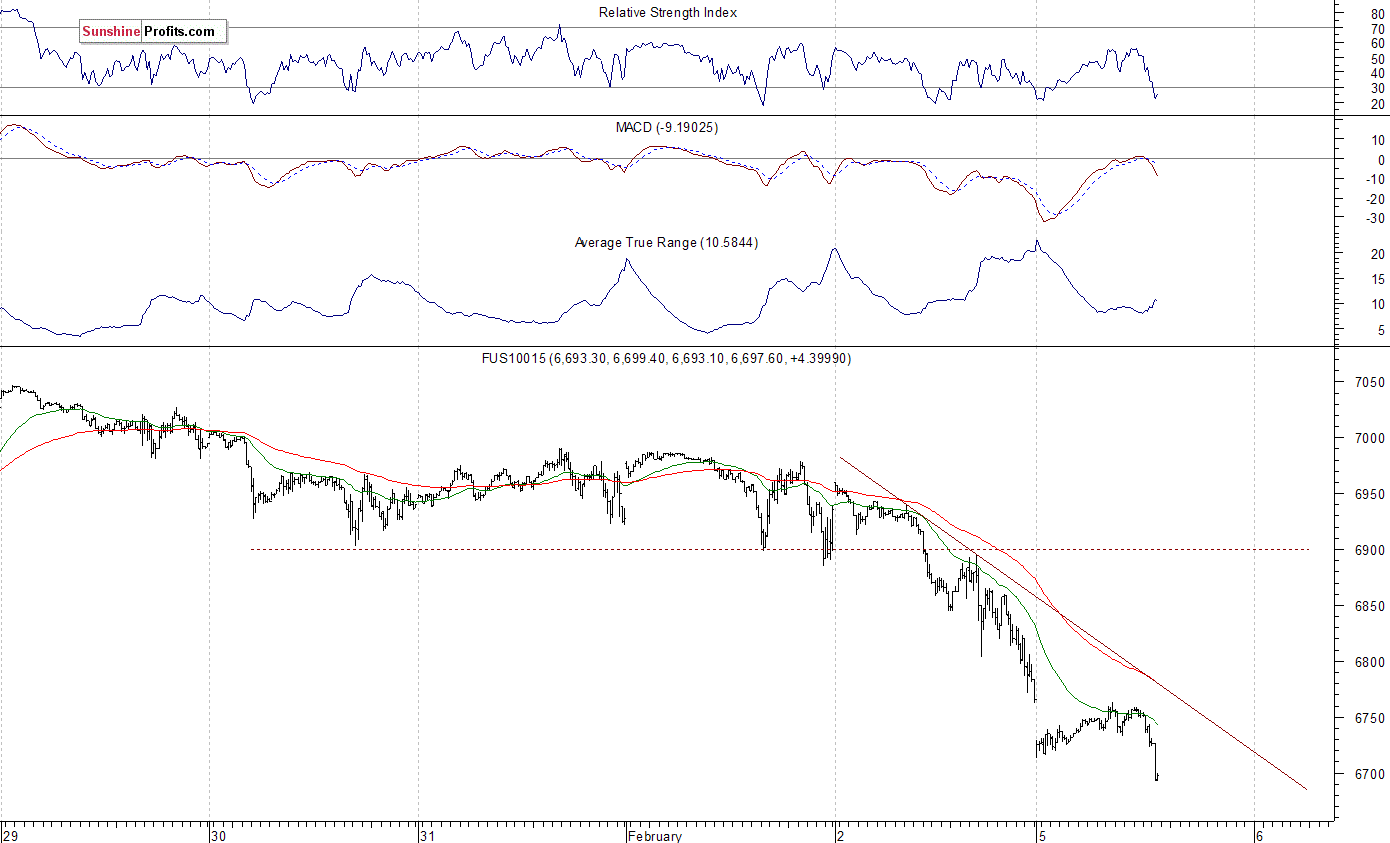
The technology Nasdaq 100 futures contract follows a similar path, as it continues its short-term downtrend today. It extends its Friday’s sell-off after an overnight gap-down opening. The nearest important level of resistance remains at around 6,750-6,760, and the next resistance level is at 6,800, among others. On the other hand, potential support level is at 6,680-6,700. The Nasdaq futures contract trades below its short-term downward trend line, as we can see on the 15-minute chart:
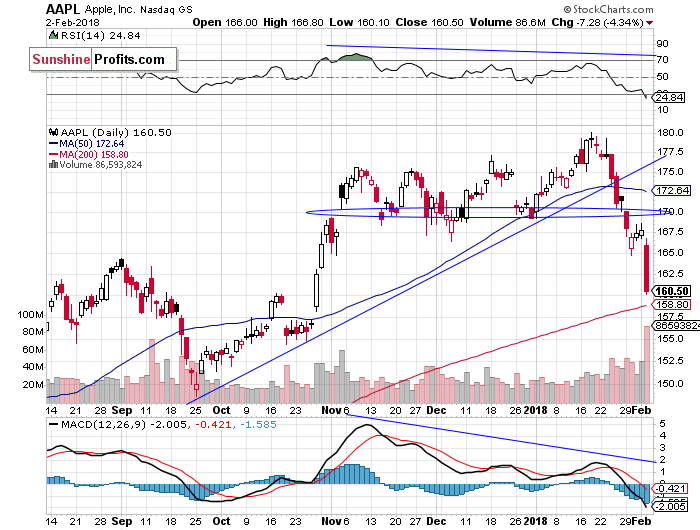
Let’s take a look at Apple, Inc. stock (AAPL) daily chart (chart courtesy of http://stockcharts.com) – worth mentioning because Apple’s market capitalization is around $850 billion, which is more than two times current value of all the cryptocurrencies combined. The stock reached new record high around three weeks ago, following short-term consolidation along the support level of $175. The market got closer to $180 mark, but it failed to continue higher. Consequently, the stock retraced its January advance and continued lower. It accelerated its decline on Friday, as it got closer to $160. We can see some short-term oversold conditions, but no confirmed positive signals so far:
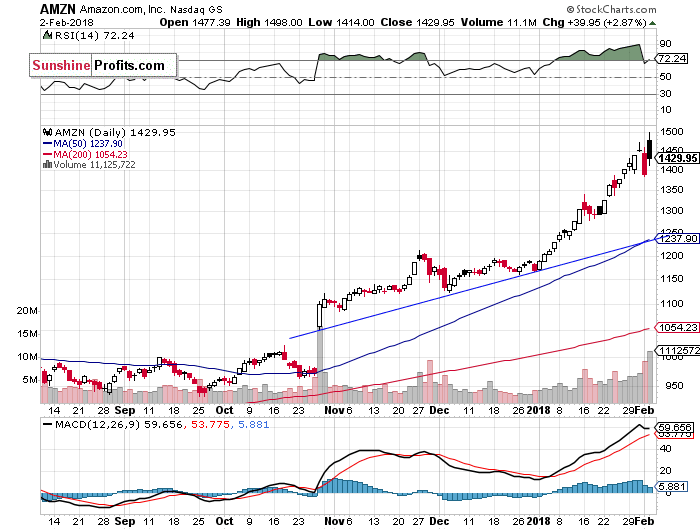
On the other hand, Amazon.com, Inc. stock (AMZN) was relatively strong vs. the broad stock market. Despite an overall weakness, it further extended its month-long rally recently. The stock even reached new record high on Friday, before closing slightly lower. It remained above the level of $1,400 following bouncing off $1,500 mark. The market may be trading within some medium-term topping pattern here:
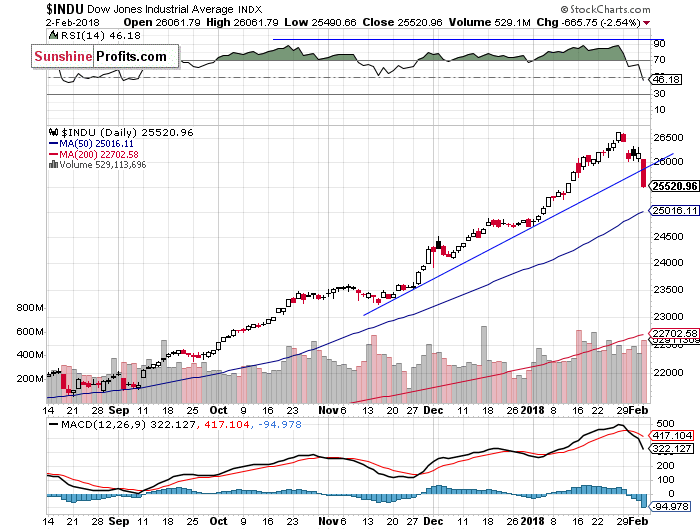
The Dow Jones Industrial Average daily chart shows that blue-chip index broke below its short-term consolidation on Friday. The price broke below the level of 26,000 and continued lower. We still can see medium-term negative technical divergences – the most common divergences are between asset’s price and some indicator based on it (for instance the index and RSI based on the index). In this case, the divergence occurs when price forms a higher high and the indicator forms a lower high. It shows us that even though price reaches new highs, the fuel for the uptrend starts running low.
The DJIA broke below its three-month-long upward trend line. Is this a new downtrend or still just correction? For now, it looks like a downward correction, because it retraces relatively small amount of its months-long rally:
Concluding, the S&P 500 index sold off on Friday, as it lost more than 2% following breakout below its three-day-long consolidation and the support level of 2,800. The broad stock market continued its short-term downtrend after some important economic data, quarterly earnings releases. Investors took profits off the table following the unprecedented month-long rally. Is this a new downtrend or just downward correction? For now, it looks like a quick correction, but a little more downside and we may see some panic in the stock market. Friday’s sell-off sets the tone for weeks to come – new record highs seem like some very unlikely scenario now.
The S&P 500 index traded around 7.5% above its December 29 yearly closing price on Friday January 26. This almost month-long rally seems unprecedented. The legendary investor John Templeton once said that “bull markets are born on pessimism, grow on skepticism, mature on optimism and die on euphoria”. So, was this an euphoria phase of the nine-year-long bull market? It’s hard to say, but some major downside risks are growing.
We still can see some medium-term overbought conditions. We can use indicators such as Relative Strength Index (RSI), Stochastic Oscillator, Money Flow Index to identify overbought conditions. For example, one can view a given market as “overbought” if the RSI indicator for this market is above 70. Paying attention to the overbought/oversold status of the market is very useful, but there are many other factors that need to be considered before placing a trade.
If you enjoyed the above analysis and would like to receive free follow-ups, we encourage you to sign up for our daily newsletter – it’s free and if you don’t like it, you can unsubscribe with just 2 clicks. If you sign up today, you’ll also get 7 days of free access to our premium daily Gold & Silver Trading Alerts. Sign up today!.
Thank you.
Paul Rejczak
Stock Trading Strategist
Stock Trading Alerts
Sunshine Profits – Free Stock Market Analysis


