The U.S. stock market indexes gained between 0.9% and 1.7% on Friday, as investors reacted to monthly jobs data release, among others. The S&P 500 index got closer to its recent local highs again after bouncing off 2,700 mark on Thursday. It currently trades 4.8% below January’s 26th record high of 2,872.87. The Dow Jones Industrial Average gained 0.9%, and the technology Nasdaq Composite gained 1.7% on Friday, as tech stocks were relatively stronger than the broad stock market.
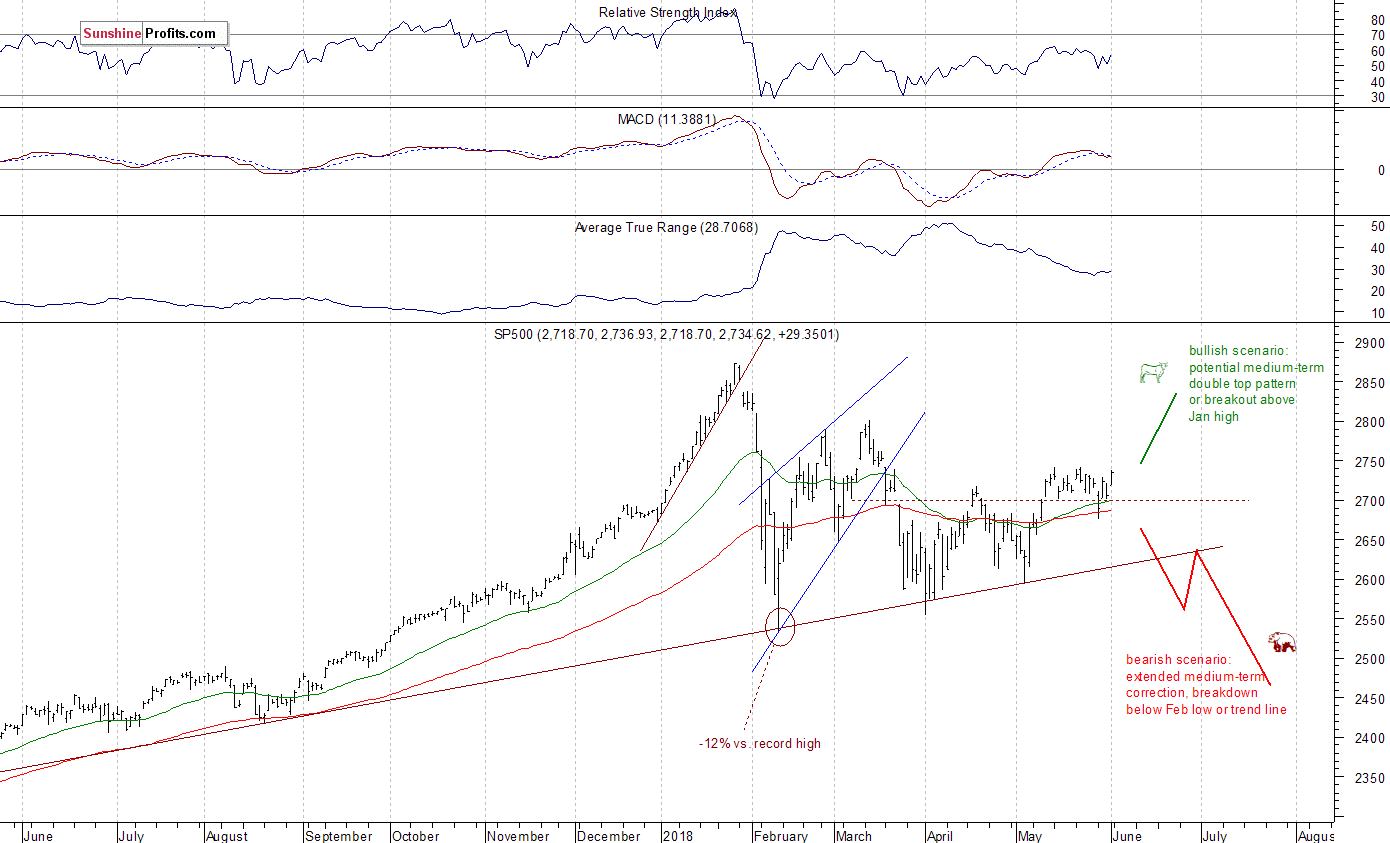
The nearest important level of resistance of the S&P 500 index is at around 2,740-2,750, marked by previous local highs along with mid-March local high. There was also the daily gap-down of 2,741.38-2,749.97 on March the 19th. Potential level of resistance is also at 2,780-2,800. On the other hand, support level remains at 2,700-2,720, marked by recent price action.
The broad stock market extended its short-term uptrend in the beginning of May, as the S&P 500 index broke above the level of 2,700. Then the market traded within a consolidation. Stocks broke lower a week ago, as the index fell below 2,700 mark, but they quickly retraced their decline. Friday’s rally brought us back to recent local highs. There are still two possible medium-term scenarios – bearish that will lead us below February low following trend line breakdown, and the bullish one in a form of medium-term double top pattern or breakout towards 3,000 mark. There is also a chance that the market will just go sideways for some time, and that would be positive for bulls in the long run (some kind of an extended flat correction):

Positive Expectations, but Still at Resistance Level
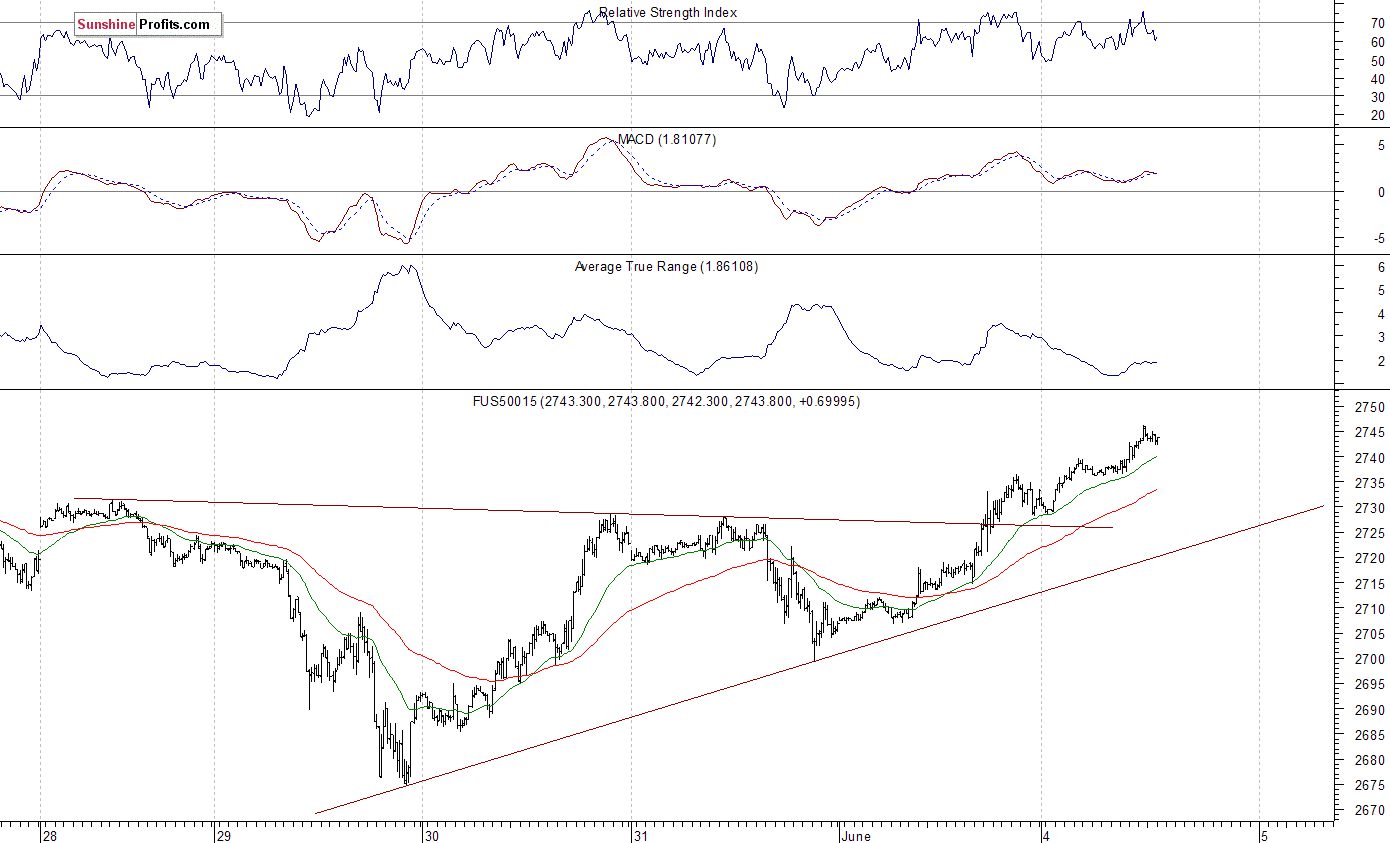
Expectations before the opening of today’s trading session are positive, because the index futures contracts trade 0.3-0.5% higher vs. their Thursday’s closing prices. The main European stock market indexes have gained 0.3-0.7% so far. Investors will wait for the Factory Orders number release at 10:00 a.m. The broad stock market will likely extend its Friday’s advance today. But will the S&P 500 index break above its three-week-long consolidation? There may be some more short-term uncertainty ahead. The S&P 500 futures contract trades within an intraday uptrend, as it continues its Friday’s advance. The market broke slightly above its recent local highs, but it is still below the resistance level of around 2,740-2,750. On the other hand, support level is at 2,725-2,730, marked by short-term local highs, among others. The futures contract trades above its upward trend line, as we can see on the 15-minute chart:
Nasdaq Gets Closer to Record High
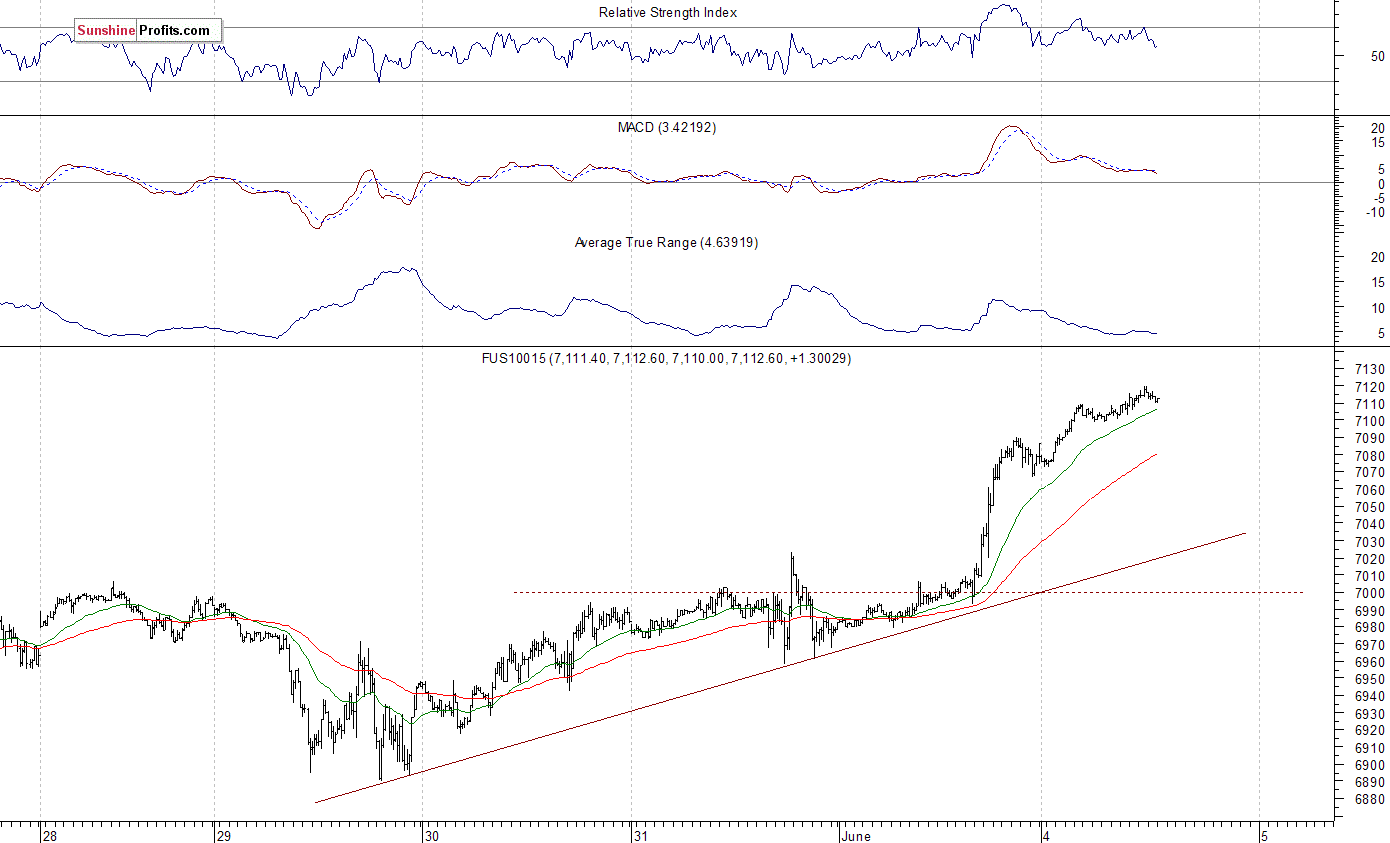
The technology Nasdaq 100 futures contract follows a similar path, as it extends its Friday’s rally. Tech stocks are relatively stronger than the broad stock market, as the index trades along the level of 7,000. It has gained over 200 points from last Wednesday’s local low. Potential level of resistance is at around 7,200, marked by mid-March all-time high. On the other hand, support level is at 7,060-7,100, among others. The Nasdaq futures contract accelerated its short-term uptrend, as the 15-minute chart shows:
Big Cap Tech Stocks at New All-Time Highs
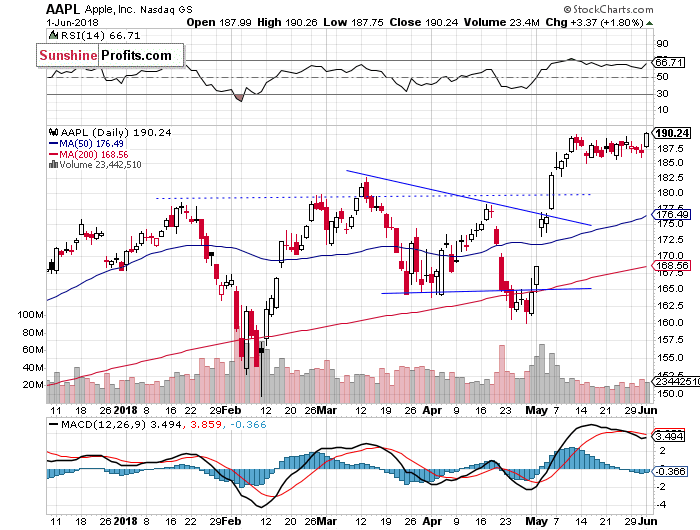
Let’s take a look at Apple, Inc. stock (AAPL) daily chart (chart courtesy of http://stockcharts.com). It reached new record high on Friday, as it broke slightly above its recent trading range. There is still a resistance level of around $190-200. Bulls are much happier than they were on Thursday, but will uptrend continue? There have been no confirmed short-term negative signals so far:
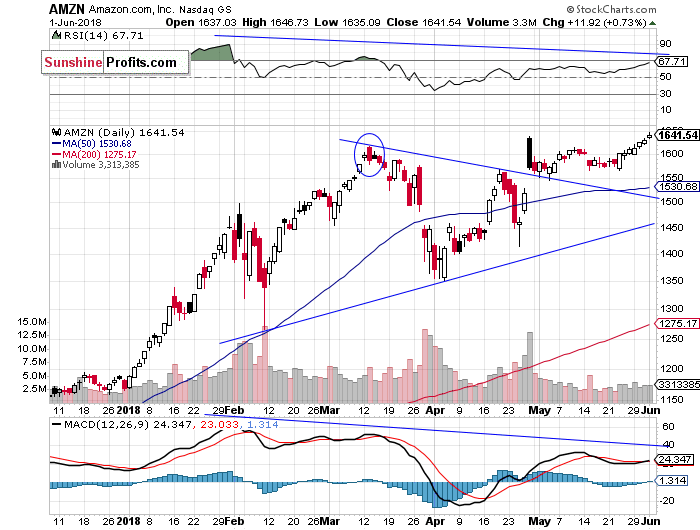
Now let’s take a look at Amazon.com, Inc. stock (AMZN) daily chart. It has also reached new record high on Friday. We were recently saying that its price action looked pretty bullish. And the stock did break higher! Potential level of resistance is at around $1,650. We can see some negative technical divergences. But there have been no confirmed negative signals so far:
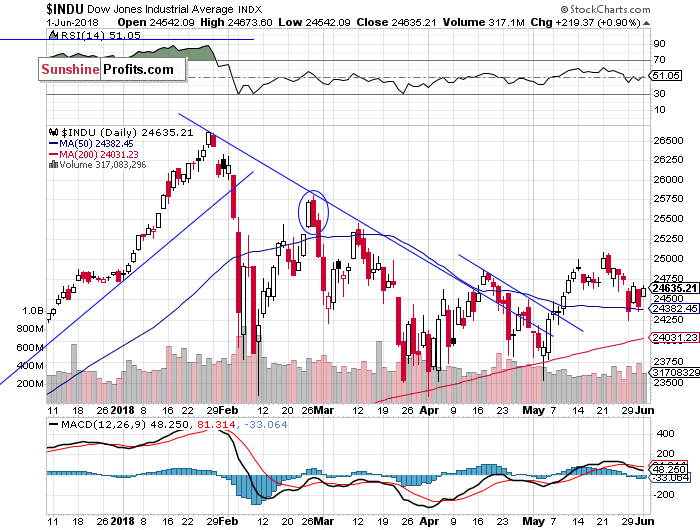
Blue Chips Stocks Still Weaker
The Dow Jones Industrial Average broke above its medium-term downward trend line in the first half of May. Then it continued higher above a few-week-long downward trend line. However, it kept bouncing off resistance level of 25,000. Almost two weeks ago we saw negative bearish engulfing candlestick pattern. The market broke below its recent consolidation a week ago, as it confirmed its short-term downward reversal. Potential level of support remains at around 24,000, and on the other hand, resistance level is at 24,800-25,000:
The broad stock market got closer to its recent local highs on Friday, as tech stocks sector rallied higher. Will uptrend continue? Or will it fade like before? It is still just a few-week-long sideways movement, but bulls are much happier than on Thursday. If the S&P 500 index breaks above its resistance level of around 2,740-2,750, we could see some buying pressure. However, just like we wrote in our several Stocks Trading Alerts, the early February sell-off sets a negative tone for weeks or months to come.
Concluding, the S&P 500 index will likely open higher today and it will probably continue its Friday’s advance. However, we may see some more short-term uncertainty as stocks get close to their resistance level. But there have been no confirmed negative signals so far.
If you enjoyed the above analysis and would like to receive free follow-ups, we encourage you to sign up for our daily newsletter – it’s free and if you don’t like it, you can unsubscribe with just 2 clicks. If you sign up today, you’ll also get 7 days of free access to our premium daily Gold & Silver Trading Alerts. Sign up today!
Thank you.
Paul Rejczak
Stock Trading Strategist
Stock Trading Alerts
Sunshine Profits – Free Stock Market Analysis


