Forex trading Alert originally sent to subscribers on February 10, 2017, 6:53AM.
Yesterday, the U.S. dollar moved sharply higher against the yen (the biggest gain since late January) as the combination of a better-than-expected initial jobless claims numbers and comments from U.S. President Donald Trump about a “phenomenal tax plan” weighed positively on investors’ sentiment. Thus, USD/JPY climbed to its first important resistance. Will it manage to stop further increases in the coming week?
In our opinion the following forex trading positions are justified – summary:
- EUR/USD: short (a stop-loss order at 1.0957; the initial downside target at 1.0538)
- GBP/USD: none
- USD/JPY: none
- USD/CAD: long (a stop-loss order at 1.2949; the initial upside target at 1.3302)
- USD/CHF: long (a stop-loss order at 0.9879; the initial upside target at 1.0064)
- AUD/USD: short (a stop-loss order at 0.7723; the initial downside target at 0.7520)
EUR/USD
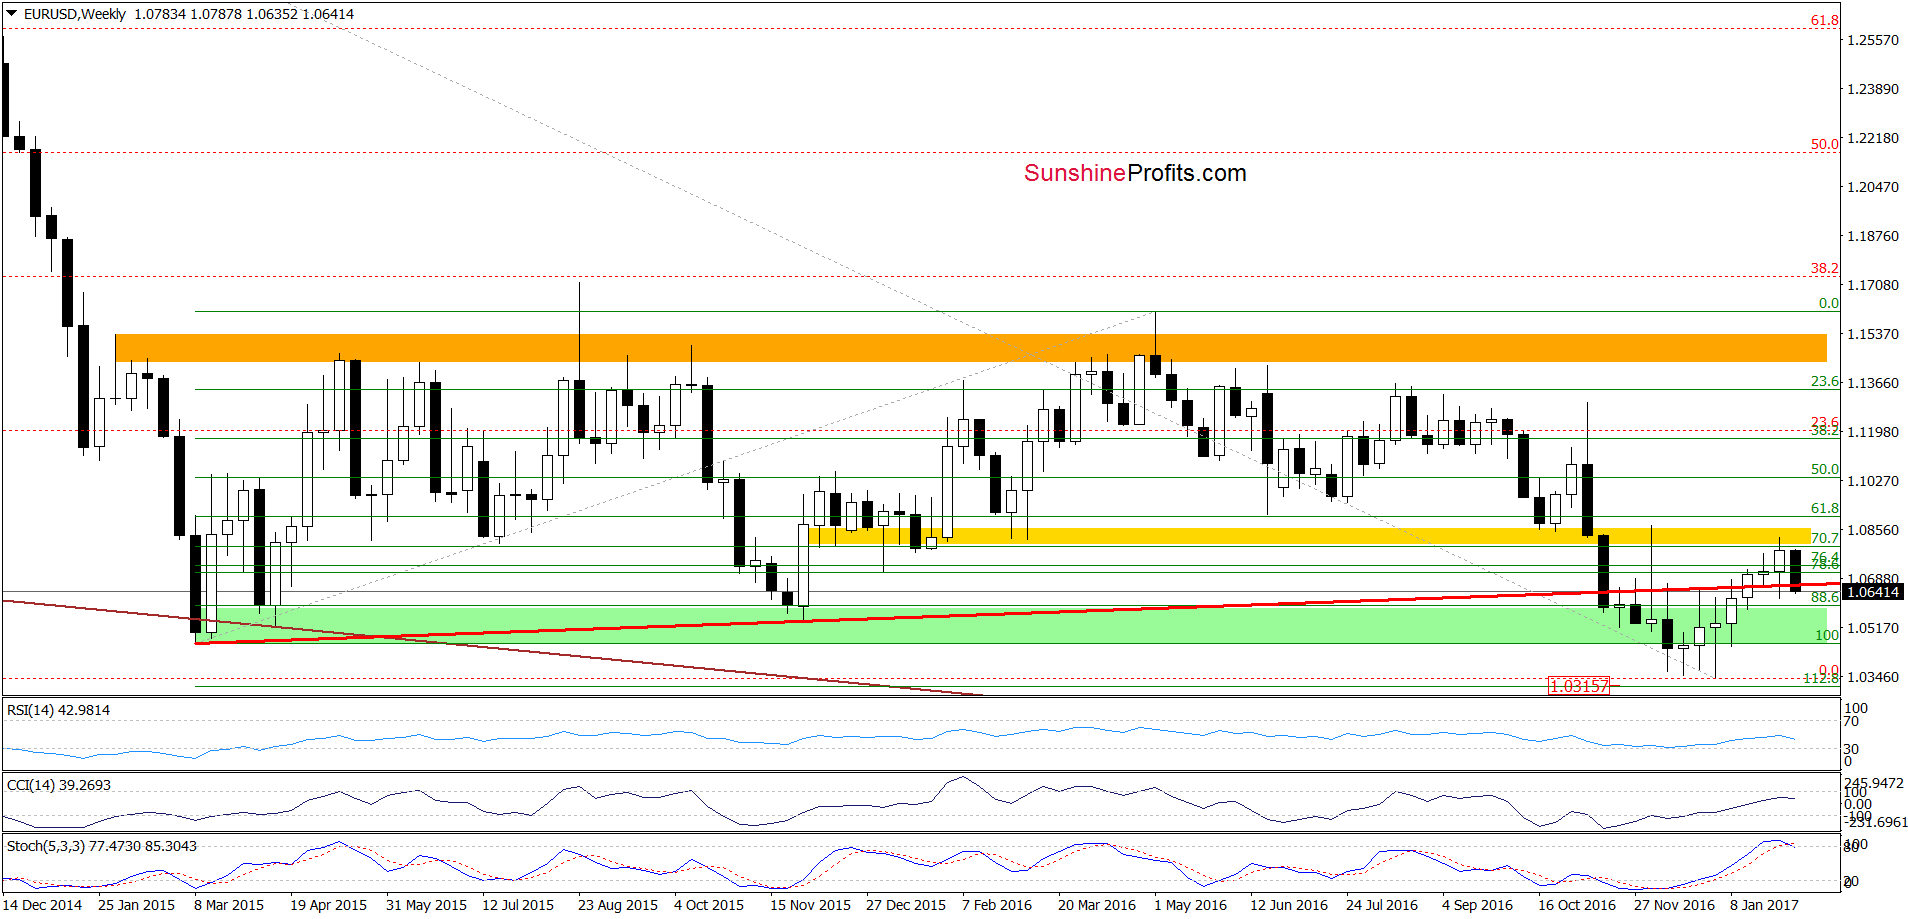

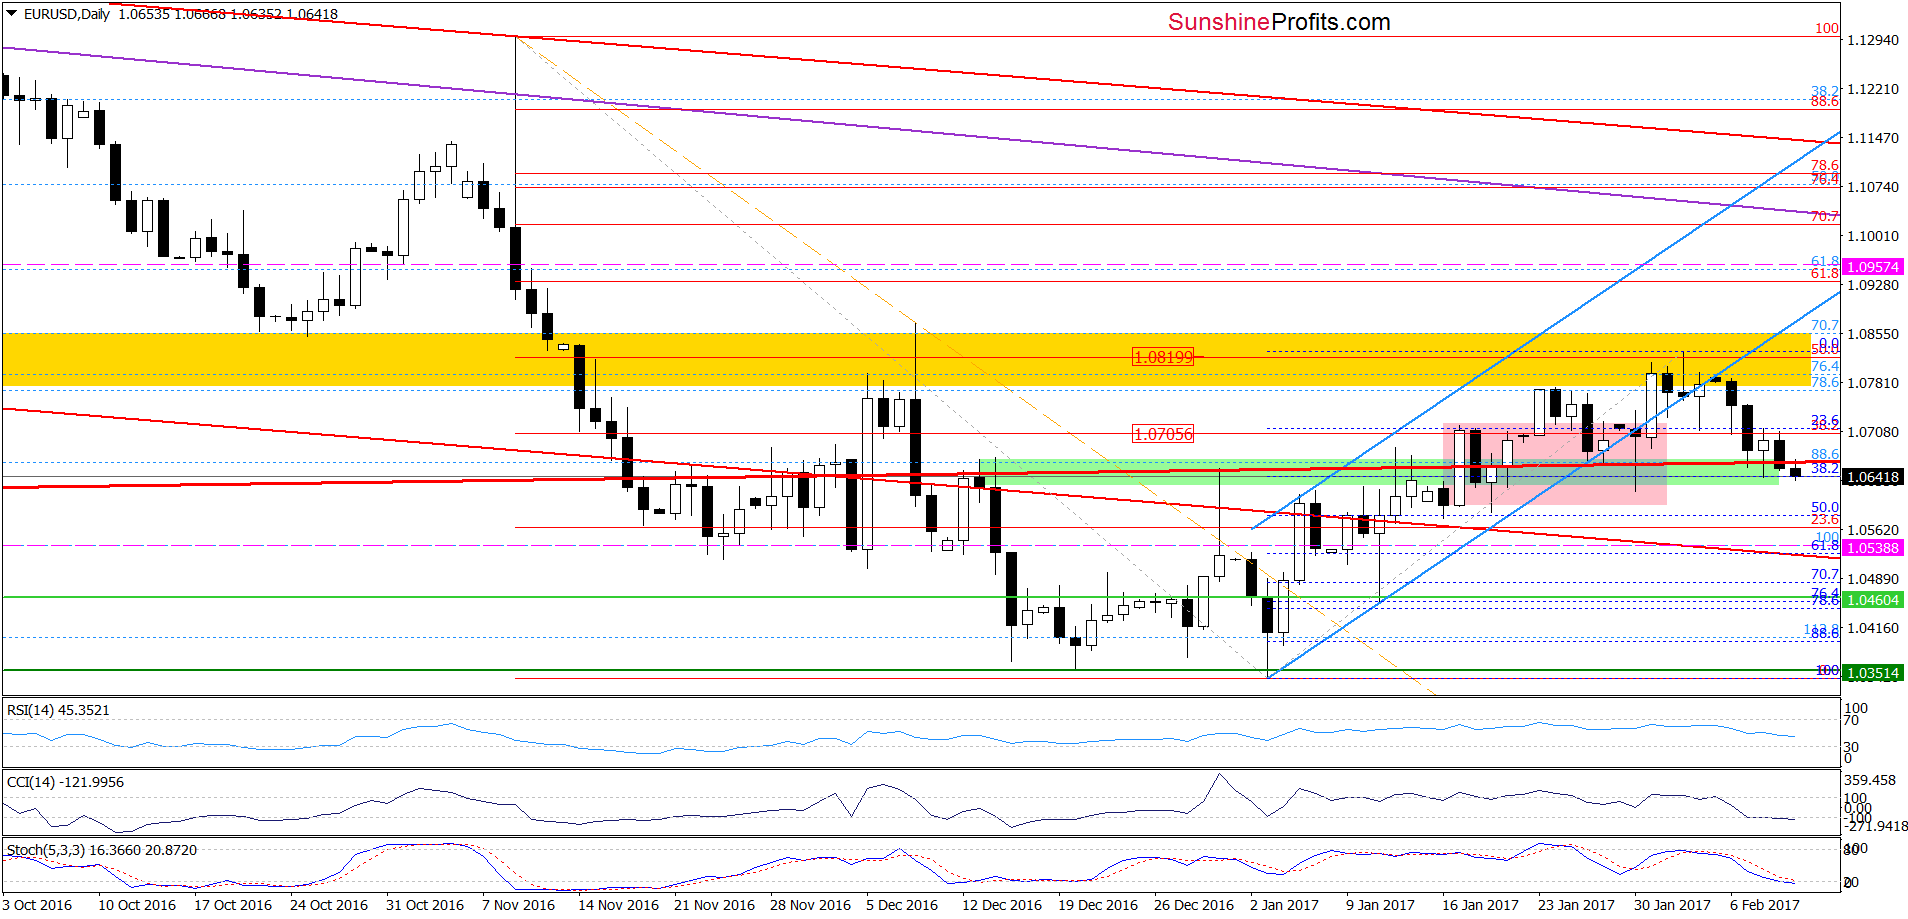
Looking at the charts, we see that although EUR/USD moved a bit higher on Wednesday, currency bulls didn’t manage to push the pair higher, which resulted in a pullback and a daily closure below the long-term red support line (seen more clearly on the weekly chart). This negative development triggered further deterioration earlier today, which means that what we wrote on Wednesday is up-to-date also today:
If (…) the pair drops under the long-term red support line (seen more clearly on the weekly chart), we’ll see (at least) a test of the lower border of the pink consolidation and the January 19 low of 1.0588 in the following days.
(…) please keep in mind what we wrote (…) about the long-term picture of EUR/USD:
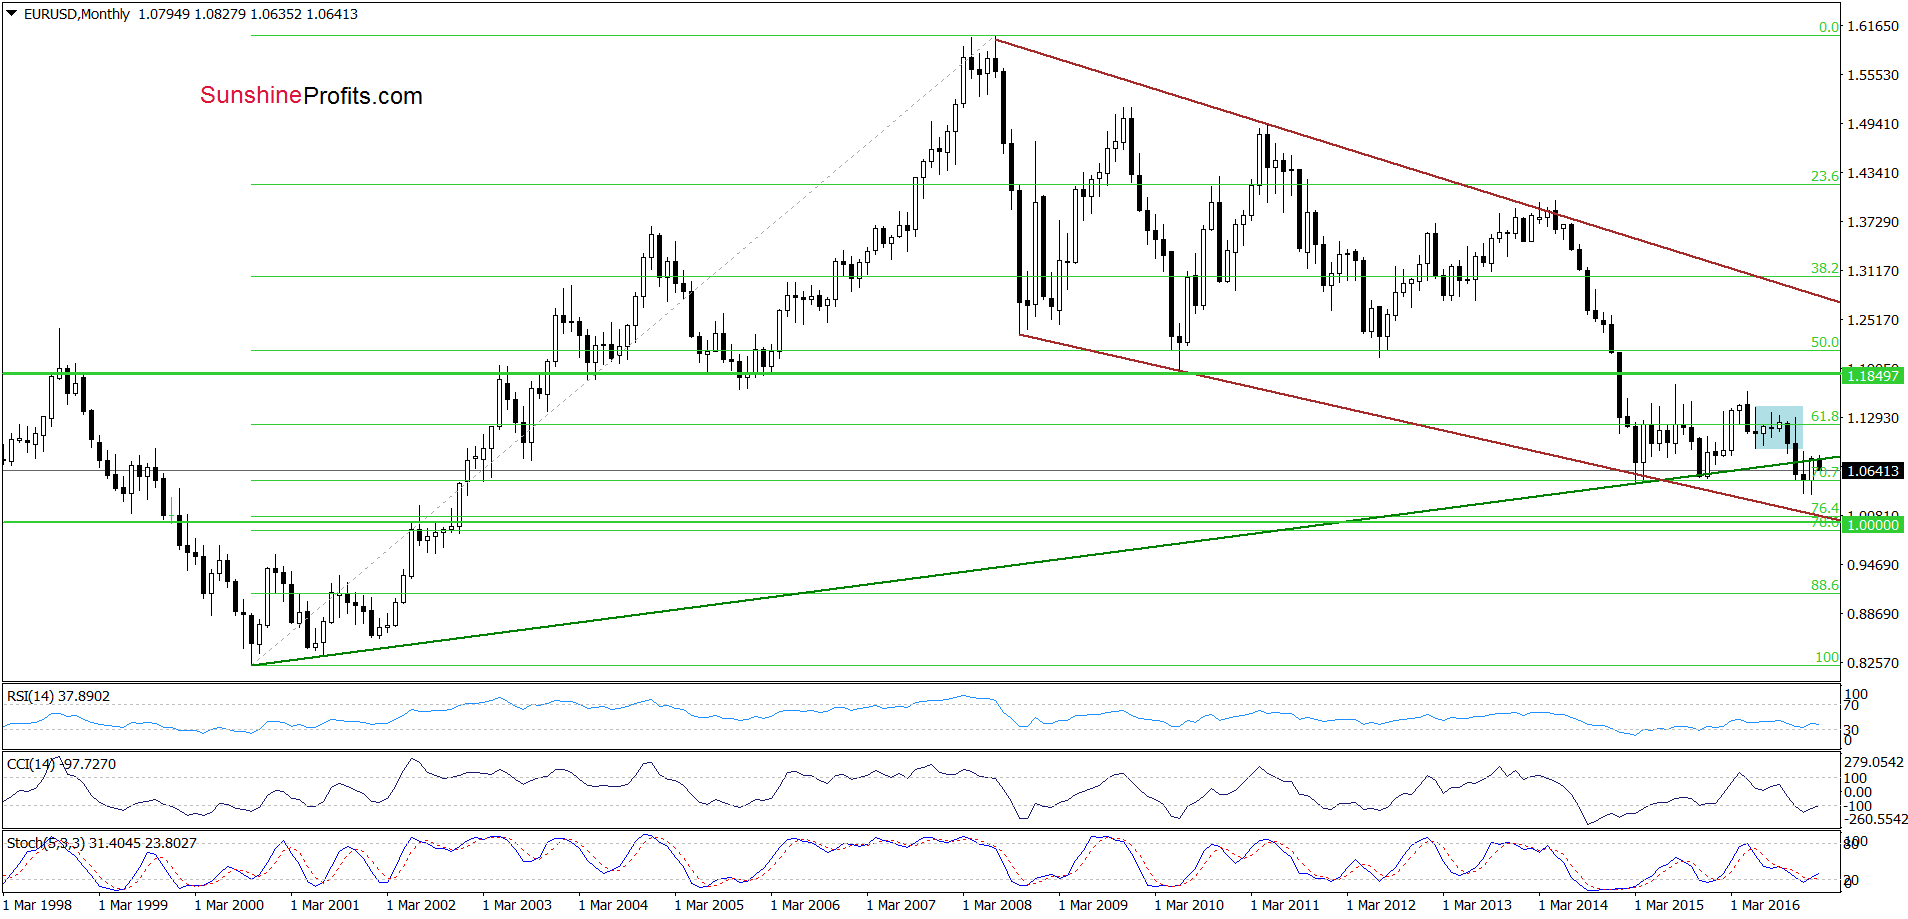
(…) the exchange rate climbed in the previous month to the previously-broken long-term green line, which serves as the key resistance now. Although currency bulls tried to push EUR/USD higher earlier this month, they failed, which resulted in a pullback. This action looks like a verification of the earlier breakdown under this important line, suggesting lover values of the exchange rate in the coming days/weeks.
Very short-term outlook: bearish
Short-term outlook: mixed with bearish bias
MT outlook: mixed
LT outlook: mixed
trading position (short-term; our opinion): Short (already profitable positions with a stop-loss order at 1.0957 and the initial downside target at 1.0538) are justified from the risk/reward perspective. We will keep you informed should anything change, or should we see a confirmation/invalidation of the above.
USD/JPY
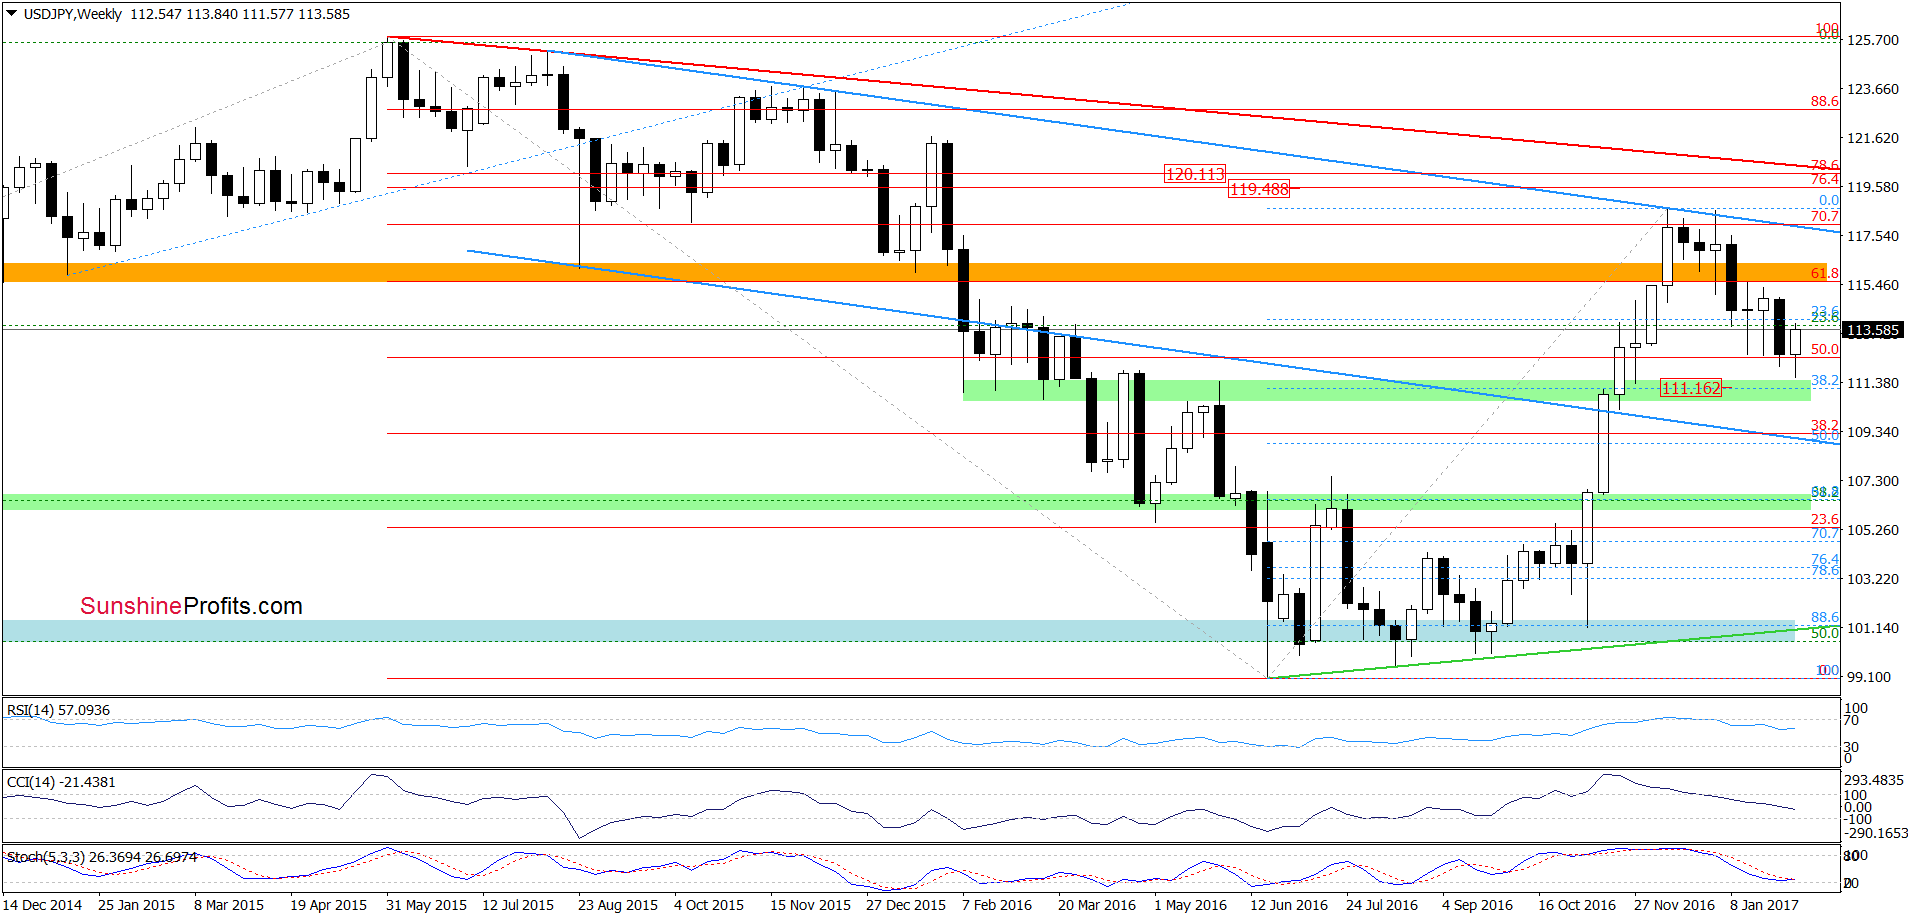
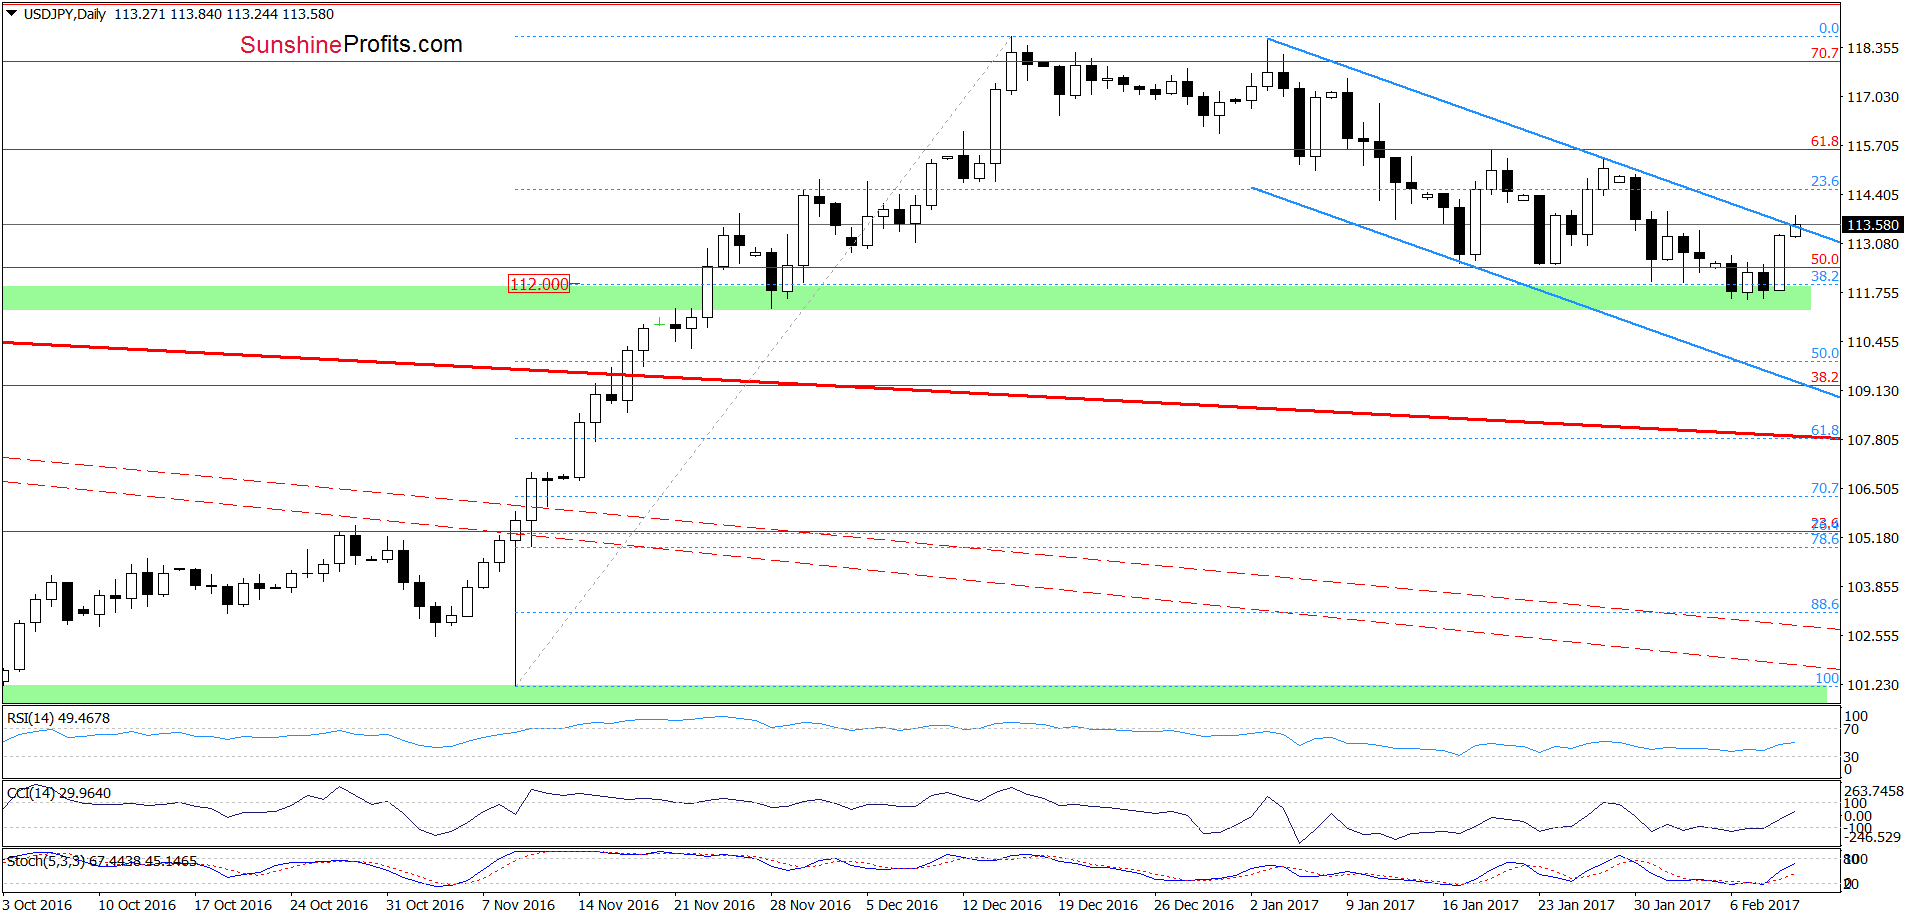
Quoting our Tuesday’s alert:
(…) USD/JPY (…) slipped slightly below the 38.2% Fibonacci retracement (…) yesterday. Despite this move, the green support zone encouraged currency bulls to act, which resulted in an invalidation of this small breakdown earlier today. Taking this event into account and the current position of the indicators (they are very close to generating buy signals), we think that further improvement is just around the corner. If this is the case, the initial upside target will be the upper border of the blue declining trend channel (currently around 113.88).
From today’s point of view, we see that the situation developed in line with the above scenario and USD/JPY reached our first upside target earlier today. What’s next? Taking into account another invalidation of the small breakdown under the 38.2% Fibonacci retracement and the buy signals generated by the indicators, we think that the pair will extend gains in the coming week. Nevertheless, such price action will be more likely and reliable if we see a daily closure above the upper border of the trend channel. In this case, we’ll see an increase to at least 115.36-115.60, where the January 19 and 27 highs are.
Very short-term outlook: mixed with bullish bias
Short-term outlook: mixed
MT outlook: mixed
LT outlook: mixed
trading position (short-term; our opinion): No positions are justified from the risk/reward perspective. However, if USD/JPY closes today’s session above the upper border of the declining trend channel, we’ll consider opening short positions.We will keep you informed should anything change, or should we see a confirmation/invalidation of the above.
USD/CHF
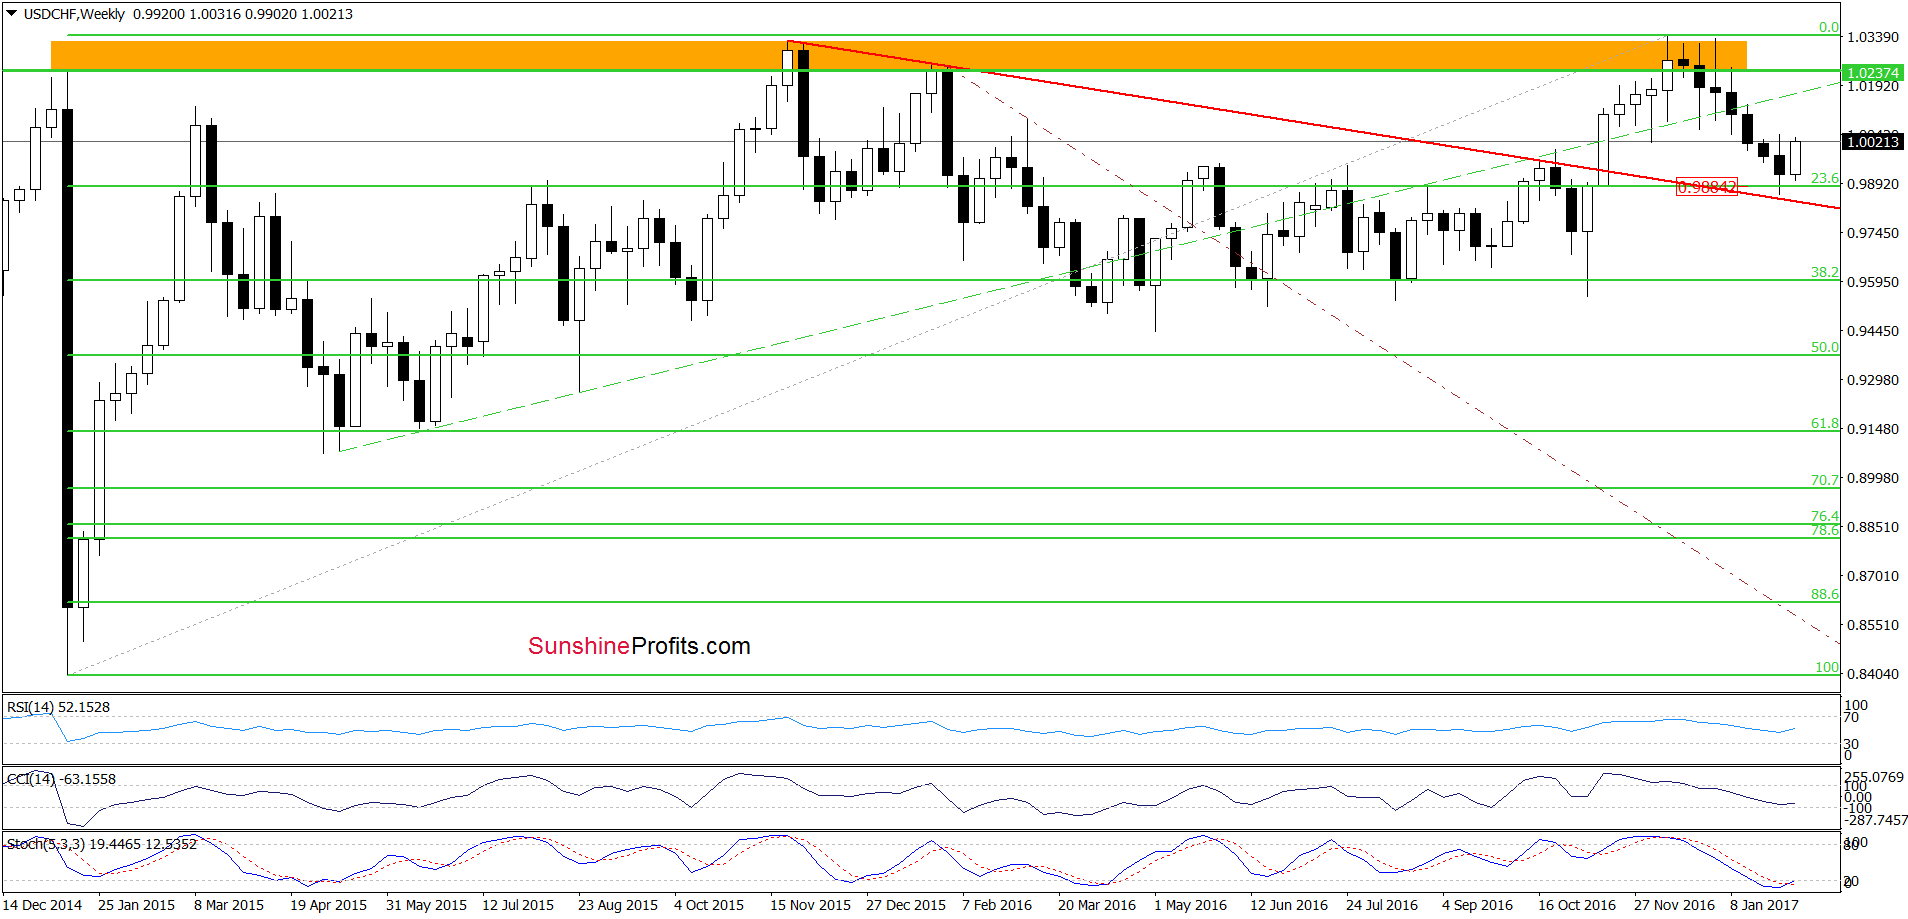
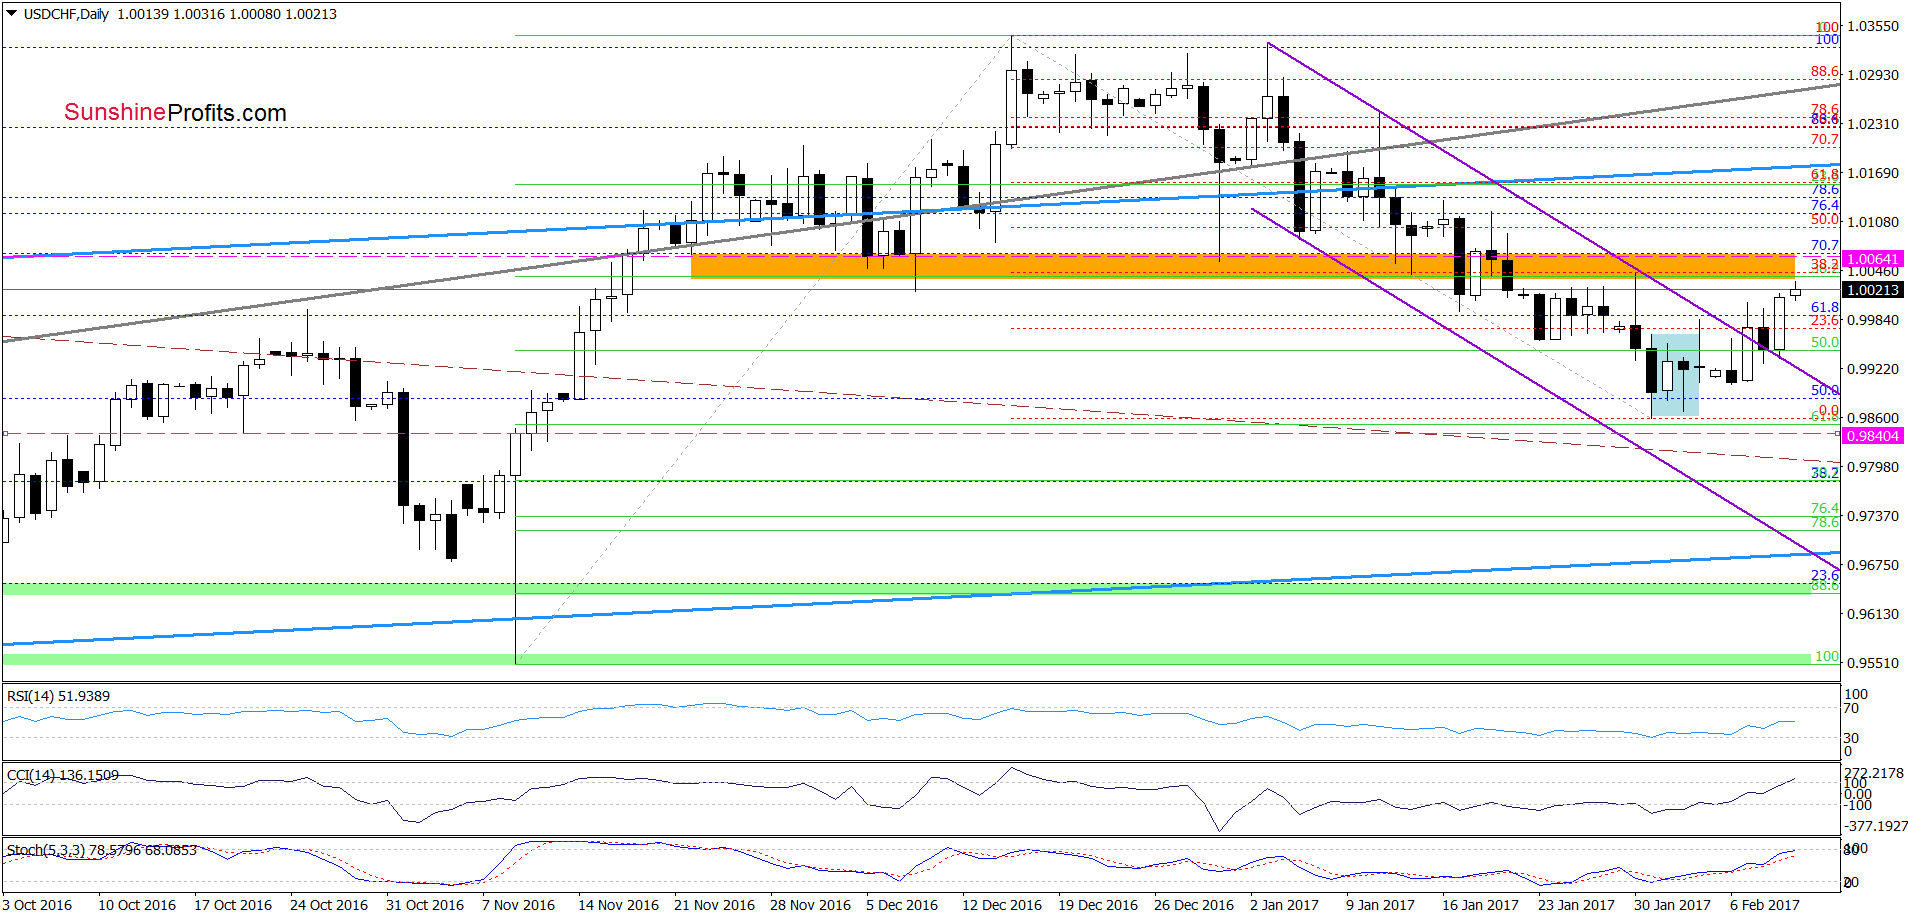
On the daily chart, we see that USD/CHF verified the earlier breakout above the upper border of the purple declining trend channel, which means that our Tuesday’s commentary is still valid:
(…) This is a bullish development, which together with the buy signals generated by the indicators suggest further improvement and (at least) a test of our initial upside target. If this area is broken, we may see even an increase to the previously-broken upper border of the blue rising trend channel (currently around 1.0172) in the following days.
Very short-term outlook: bullish
Short-term outlook: mixed with bullish bias
MT outlook: mixed
LT outlook: mixed
trading position (short-term; our opinion): Long (already profitable positions with a stop-loss order at 0.9879 and the initial upside target at 1.0064) are justified from the risk/reward perspective. We will keep you informed should anything change, or should we see a confirmation/invalidation of the above.
As a reminder – “initial target price” means exactly that – an “initial” one, it’s not a price level at which we suggest closing positions. If this becomes the case (like it did in the previous trade) we will refer to these levels as levels of exit orders (exactly as we’ve done previously). Stop-loss levels, however, are naturally not “initial”, but something that, in our opinion, might be entered as an order.
Thank you.
Nadia Simmons
Forex & Oil trading Strategist
Przemyslaw Radomski, CFA
Founder, Editor-in-chief, Gold & Silver Fund Manager
Gold & Silver trading Alerts
Forex trading Alerts
Oil Investment Updates
Oil trading Alerts


