It should be clear that the Fed’s tightening is bearish for gold, shouldn’t it? Our today’s about the history of the Fed’s tightening and its impact on the macroeconomic variables and the gold prices undermines that popular belief. We invite you to read it and draw precious metals investment conclusions from it.
We often repeat that investors should look deeper and they should not abstract from the broader macroeconomic context. So we invite you to analyze the history of the Fed’s tightening cycles, taking into account their impact on the most important macroeconomic variables. And, of course, the gold prices.
Let’s look at the table below, which shows how the federal funds rate and other key indicators changed during the Fed’s tightening cycles. As one can see, the CPI annual rate rose 1.7 percentage points during the average tightening cycle. At first glance, it may question the Fed’s ability to curb inflation. However, there are some time lags and sometimes inflation indeed declined later. Another issue is that the rise in inflation is the very reason of the tightening, so the positive value shouldn’t be surprising. What’s important here is that inflation has risen much more during the current tightening cycle. Two interpretations come to mind. First, with stronger inflation dynamics, the Fed will be more aggressive. Second, with such relatively strong increase in inflation, further upward moves – both in the CPI and the federal funds rate – are somewhat limited. Clearly, the latter narrative is more gold-friendly. But which one is true? We believe that Powell might really be more hawkish than markets expect, but we don’t expect revolution. Keep in mind that inflation started from the very low level.
Table 1: History of the US tightening cycles in the macroeconomic context (change in the federal funds rate, change in the annual CPI rate, change in the civilian unemployment rate and change in the 10-year Treasury yields)

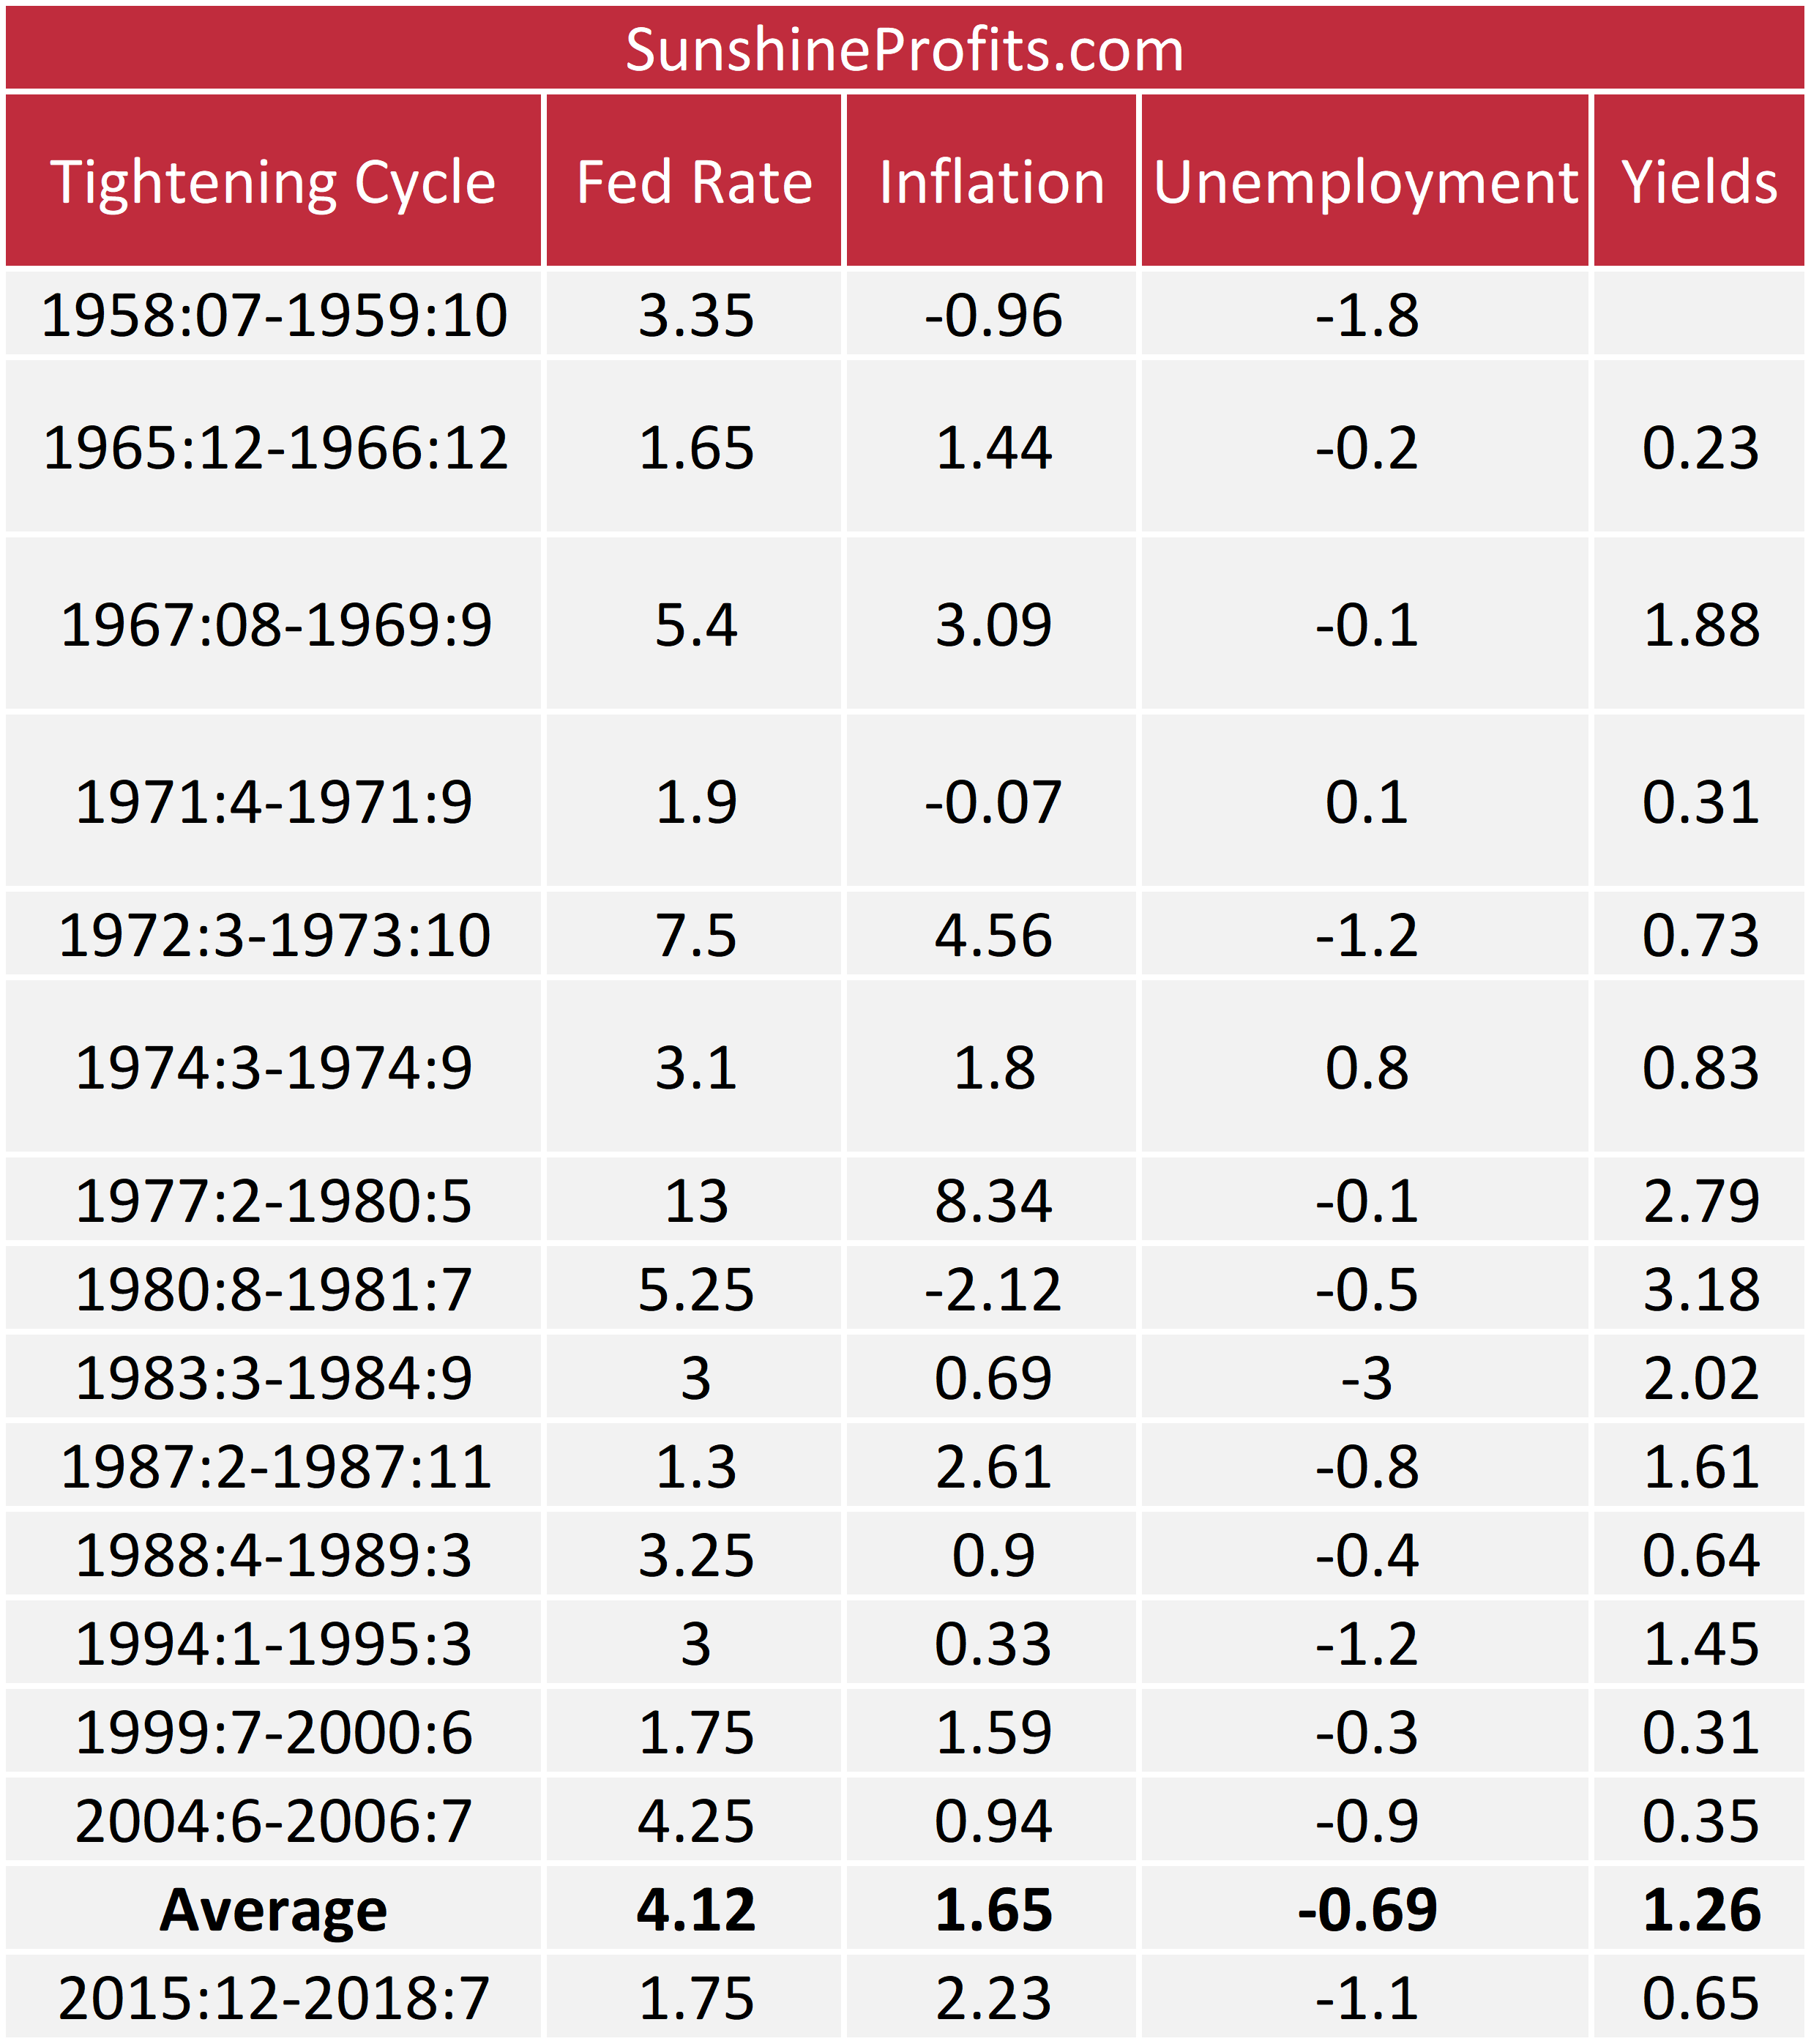
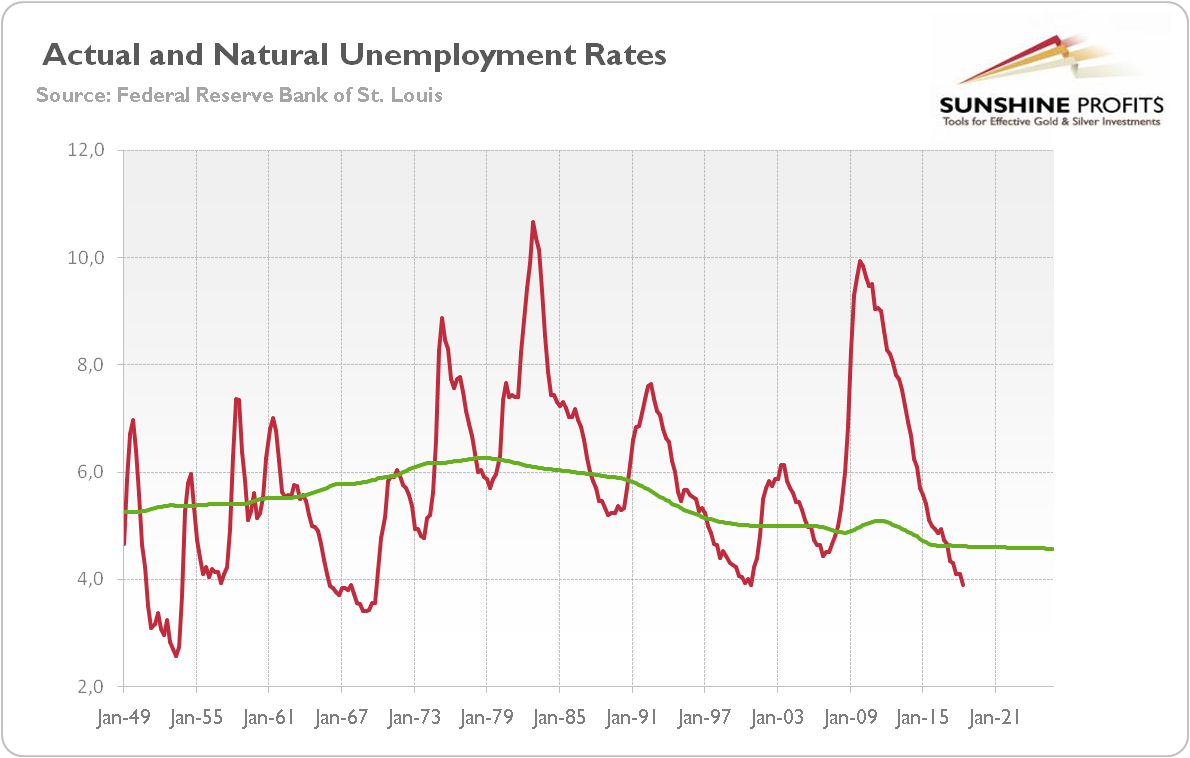
Look at the unemployment rate now. On average, it declined by 0.7 percentage point during the tightening cycle. It makes sense, as with healthy labor market, the Fed is more concerned with the potential overheating of the economy and rising inflation. Importantly, the unemployment rate has decreased by 1.1 percentage point during the current tightening, so, again, the Fed might be more hawkish than during previous cycles, which would be rather negative for the gold prices. Indeed, the actual unemployment rate is now below the so-called natural unemployment rate, as one can see in the chart below. It is the rate at which the economy is in full employment, implying the lack of either inflationary or deflationary pressures. With the unemployment rate below the natural rate, the Fed might be worried about rising prices, so it might be more aggressive than in the past. On the other hand, it is unlikely that the unemployment rate will drop even further, so the room for more hawkish actions is somewhat limited.
Chart 1: US actual unemployment rate (red line, in $) and the natural rate of unemployment (green line, in %) between 1949 and 2025 (forecasts for natural rate).
Last but not least, take a look at the long-term interest rates. As the table shows, the behavior of the long-term yields is untypical. They increase very late in the current tightening cycle and much below the historical average. The sluggish rise in the long-term yields might indicate that the bond market does not seem to anticipate solid economic growth in the future. So it might be an argument to adopt a more dovish stance. But it might also ease some worries among the FOMC members. If the hikes in the federal funds rate do not translate into similar moves in the long-term interest rates, which are actually much more important for the economy, the Fed might be less concerned about the negative effects of its tightening. Given the unemployment rate at a very low level, it might tighten more boldly. Not a good scenario for gold.
What does it all mean for the gold market? Well, it should be clear that our analysis is rather bearish for gold, shouldn’t it? But let’s look at the table below, which presents the percentage change during the Fed’s tightening cycles from the early 1970s until the present (we removed the earlier tightening as the price of gold was not free then).
Table 2: History of gold prices during the Fed’s tightening cycles (change in the federal funds rate, change in the annual CPI rate, % change in trade-weighted broad US dollar index, % change in London P.M. Fix of the gold price).
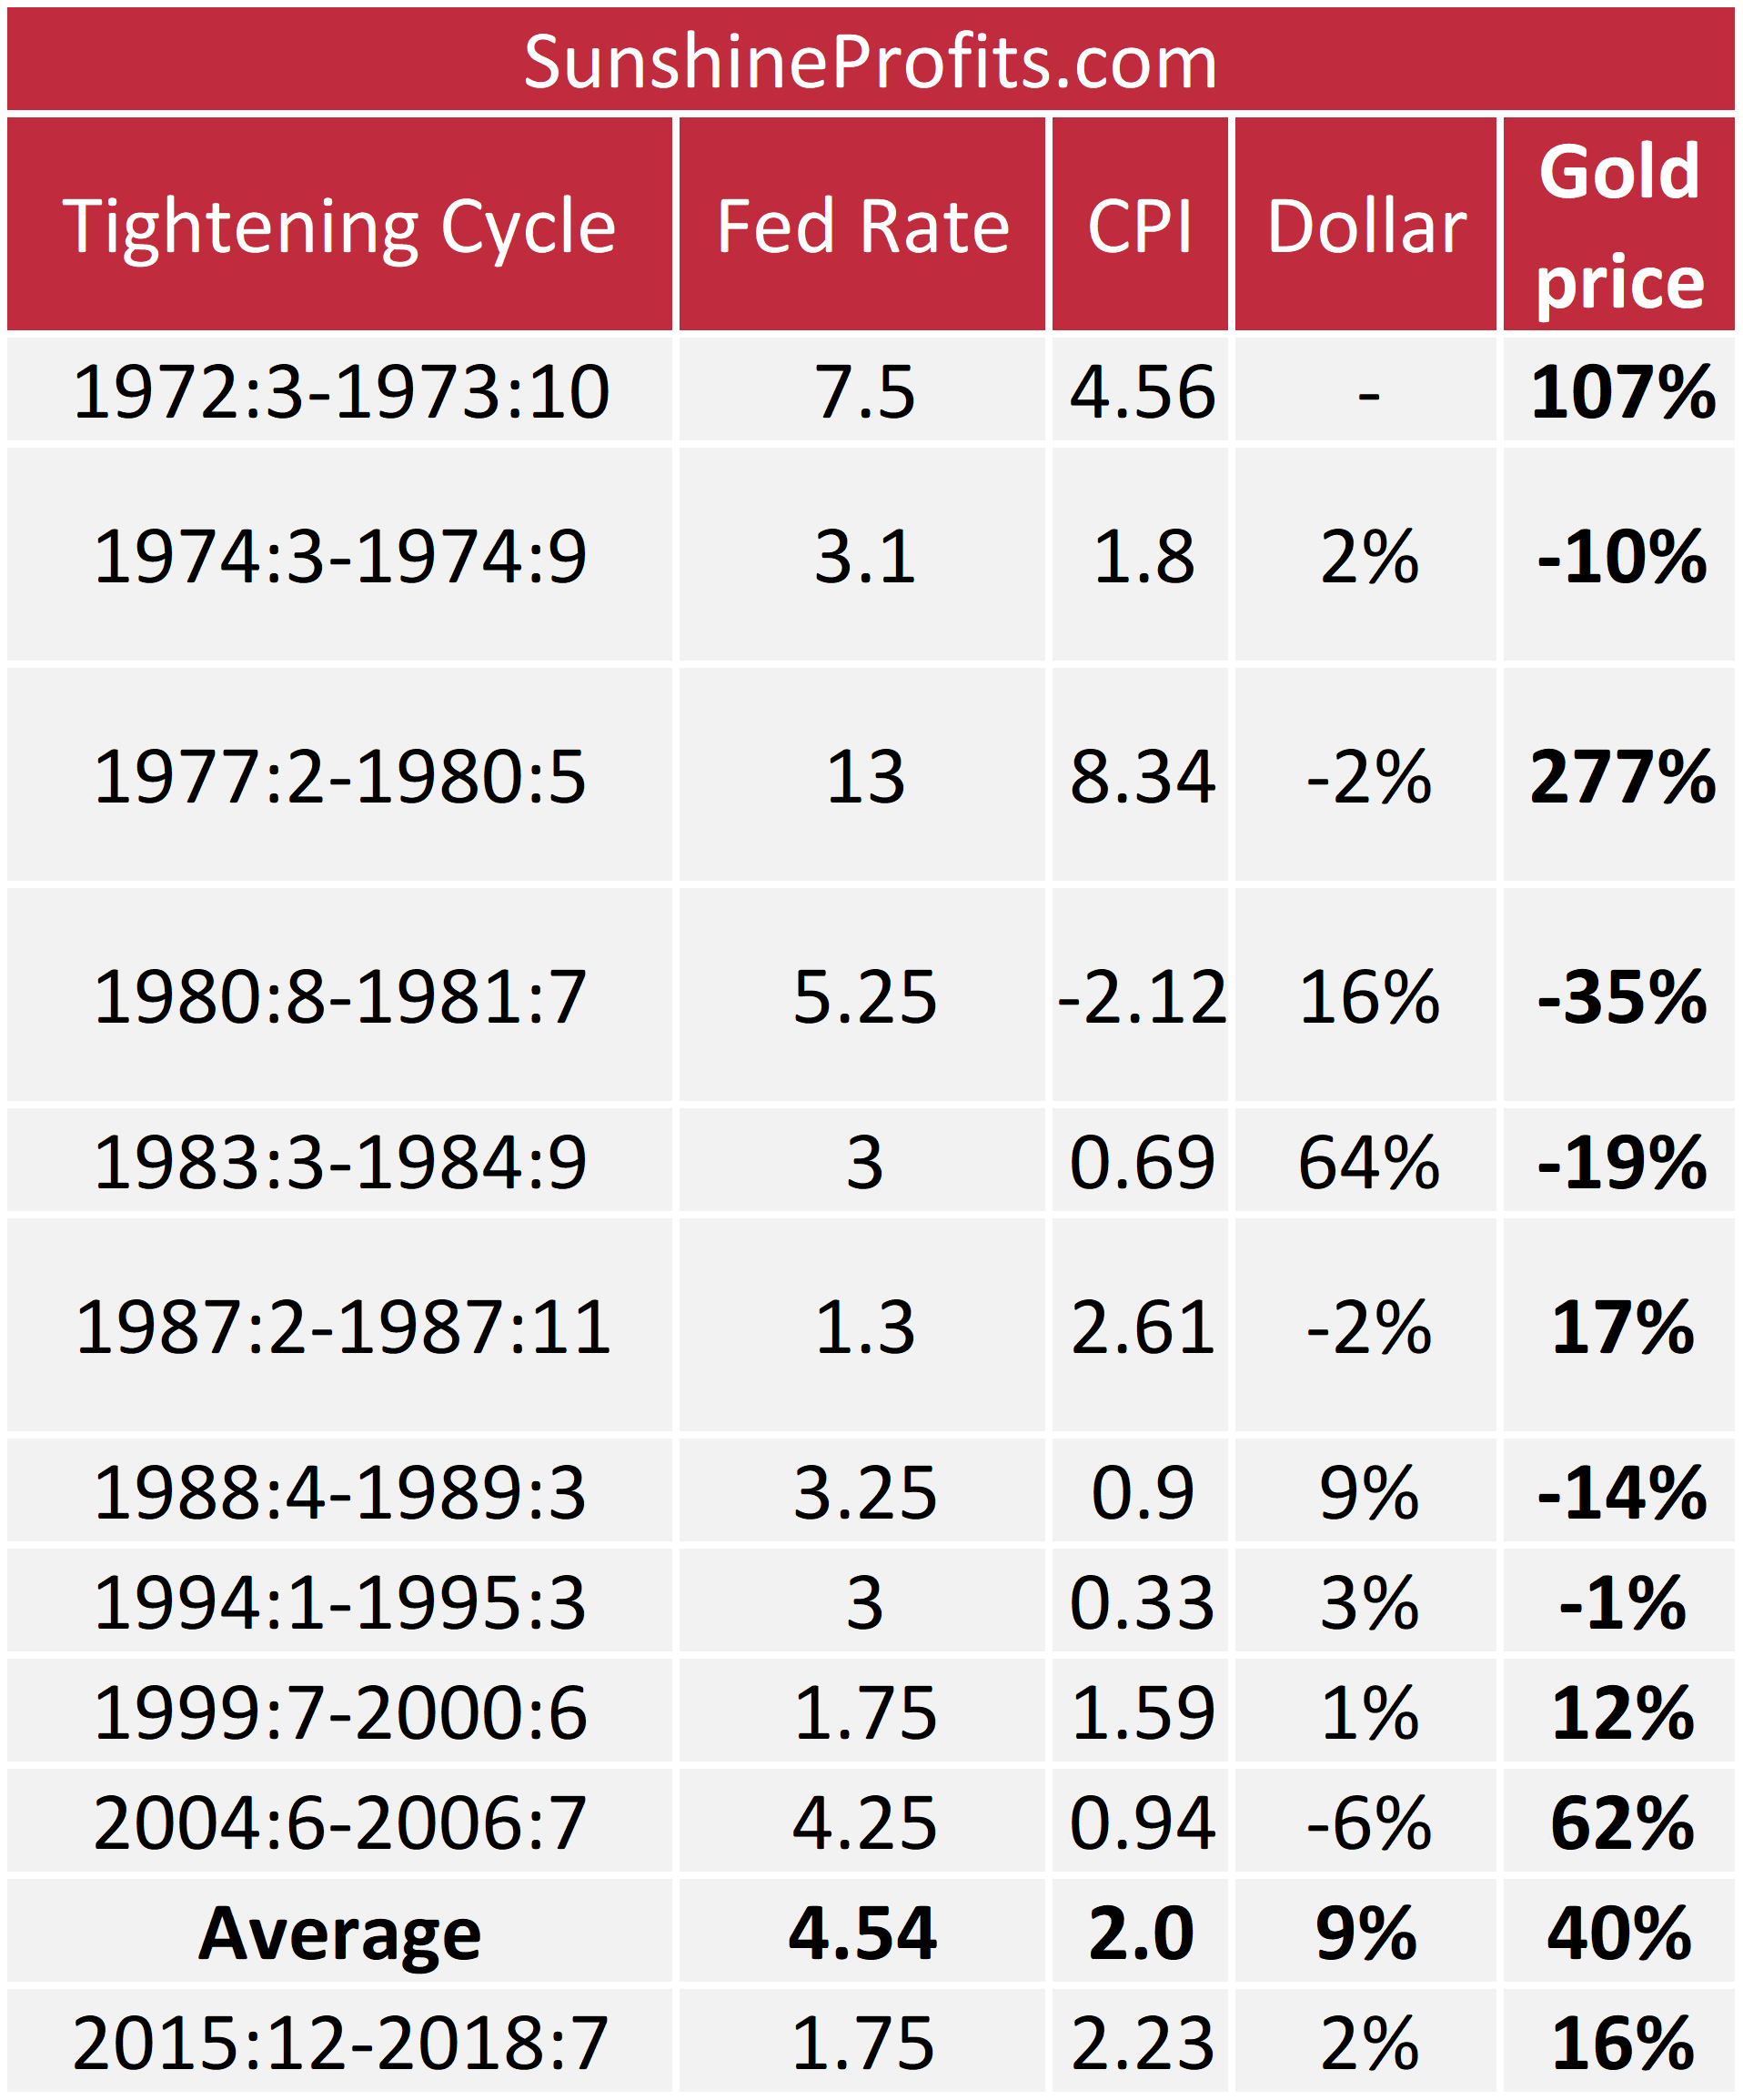
As one can see, the periods of tightening were actually positive for the gold prices, at least on average. However, the yellow metal shined the most during periods of high inflation. When prices rose very slowly, or declined, the price of gold fell. The only exception of that pattern was the previous tightening. Although the inflationary pressure was subdued, the greenback declined, so the gold prices could go up. The implication is clear: gold may actually flourish during the current tightening cycle, but only either if inflation accelerates or if the U.S. dollar declines.
It’s true that the inflation change is already stronger than on average, but we don’t expect its rapid acceleration. Given the low unemployment rate, the Fed might be more hawkish than the markets expect. Based on the previous cycles, both the long-term yields and, thus, the U.S. dollar have still room for further upward moves. That combination (more hawkish Fed, inflation in check, rising yields and greenback) should be bearish for the gold prices. Of course, there is no law determining the return to the average. And every Fed tightening cycle created a meaningful crisis somewhere. But not every crisis supports the gold prices. You have been warned!
If you enjoyed the above analysis and would you like to know more
about the macroeconomic outlook and the gold market, we invite you to
read the September Market Overview
report. If you’re interested in the detailed price analysis and price
projections with targets, we invite you to sign up for our Gold & Silver Trading Alerts.
If you’re not ready to subscribe yet and are not on our gold mailing
list yet, we urge you to sign up. It’s free and if you don’t like it,
you can easily unsubscribe. Sign up today!
Thank you.
Arkadiusz Sieron, Ph.D.
Sunshine Profits‘ Gold News Monitor and Market Overview Editor
Gold News Monitor
Gold Trading Alerts
Gold Market Overview


