
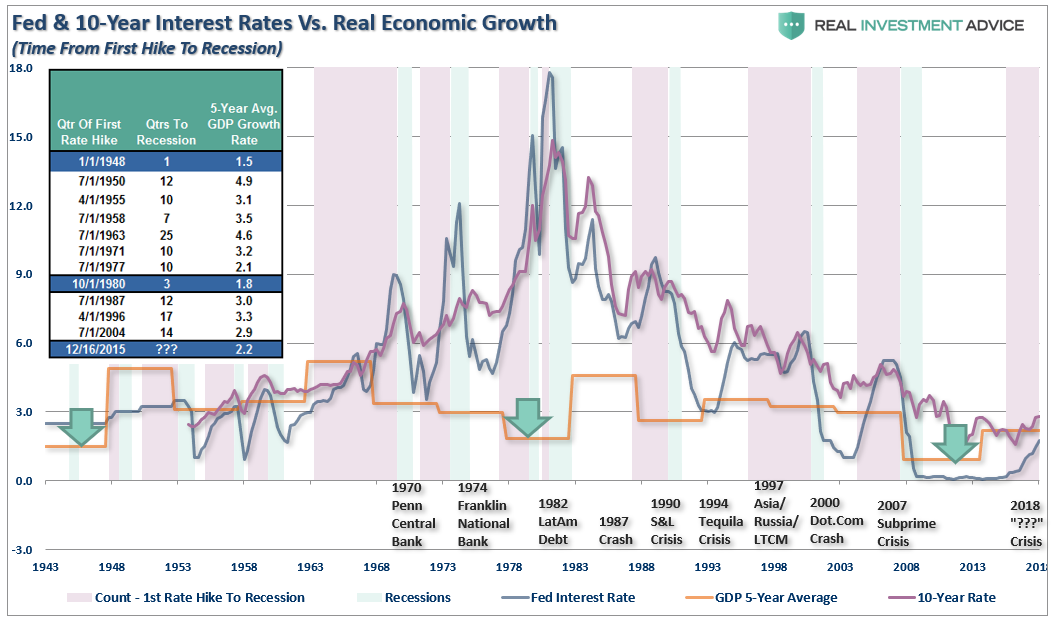
I recently penned an article which discussed the Fed and the risk of a monetary policy error in the future. This isn’t a possibility, it is a probability given that every Fed rate-hiking campaign in the past has led to a financial market-related event, recession, or worse.
Of course, when you publish views on a regular basis it always attracts those“individuals” who want to consistently deride and distract an otherwise informed debate. Normally, I don’t respond to comments because there is nothing to be gained in trying to persuade someone who is already convicted of their beliefs.
As my dad use to tell me growing up: “The only permanent cure of ignorance, is experience.”

I am going to make an exception this week as a recent comment brought to light many of the common media-driven narratives about investing. The comment was long, so I have broken it down to highlight the important points which need addressing.
The Lie Of Percentages
“The average bear market lasts 1.4 years on average and falls 41% on average.-The average bull market (when the market is rising) lasts 9.1 years on average and rises 476% on average. This fact confirms that Bull Markets do rise 10 TIMES LONGER than bear markets. And they last SIX LONGER. Those are facts.”
While the statement is not false, it is a false narrative. (It is important to remember the “buy and hold” revolution was developed by Wall Street firms beginning in the late 1980’s to shift the industry from a “transactional basis” to an “annuitized” income stream. It is great for them, not necessarily for you.)
Using “percentage changes” distorts to the true impact to what happens to investors over time. The chart below shows the PERCENTAGE return of each bull and bear market going back to 1900. (The chart is the S&P 500 Total Return Inflation-Adjusted index.)
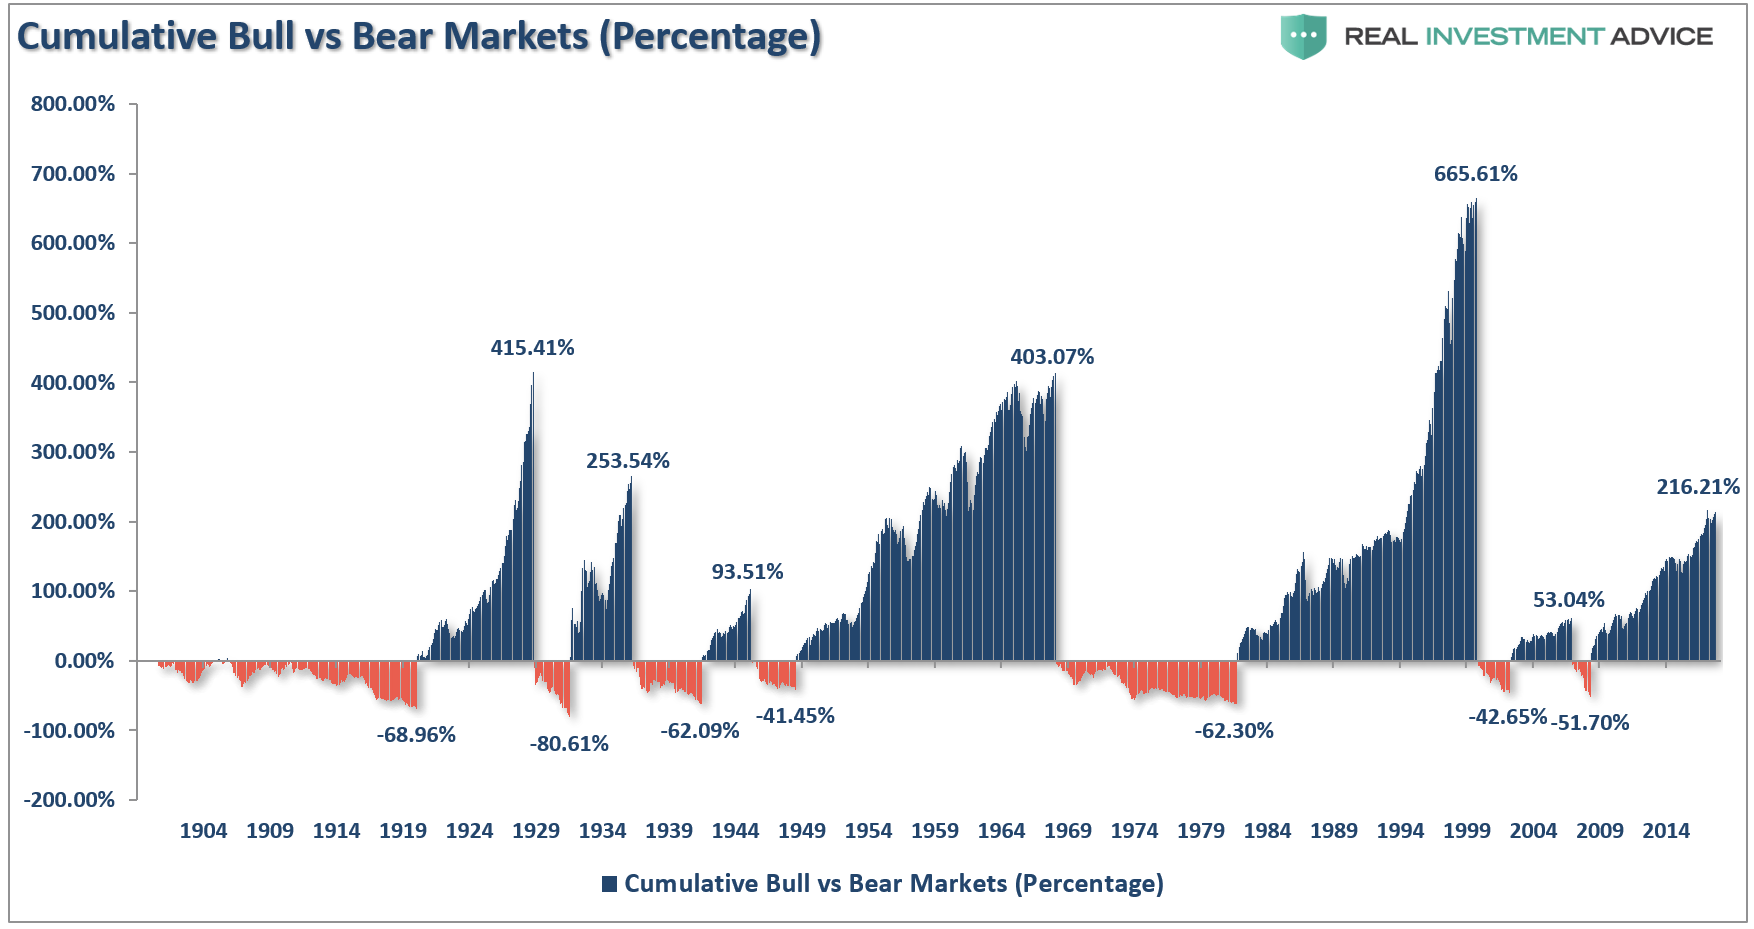
Clearly, the point made is valid that bull markets rise 10x, more and last 6x as long, as bear markets.
“Lies, Damned Lies, and Statistics.” – Mark Twain
Here are the basics of math.
- If the index goes from 100 to 200 it is indeed a 100% gain.
- If the index goes from 200 back to 100, it is only a 50% loss.
- Mathematically it would seem as if an investor is still 50% ahead, the net return is actually ZERO.
This is the error of measuring returns in terms of percentages. To understand the real impact of bull and bear markets on a portfolio it must be measured in POINTS rather than percentages.
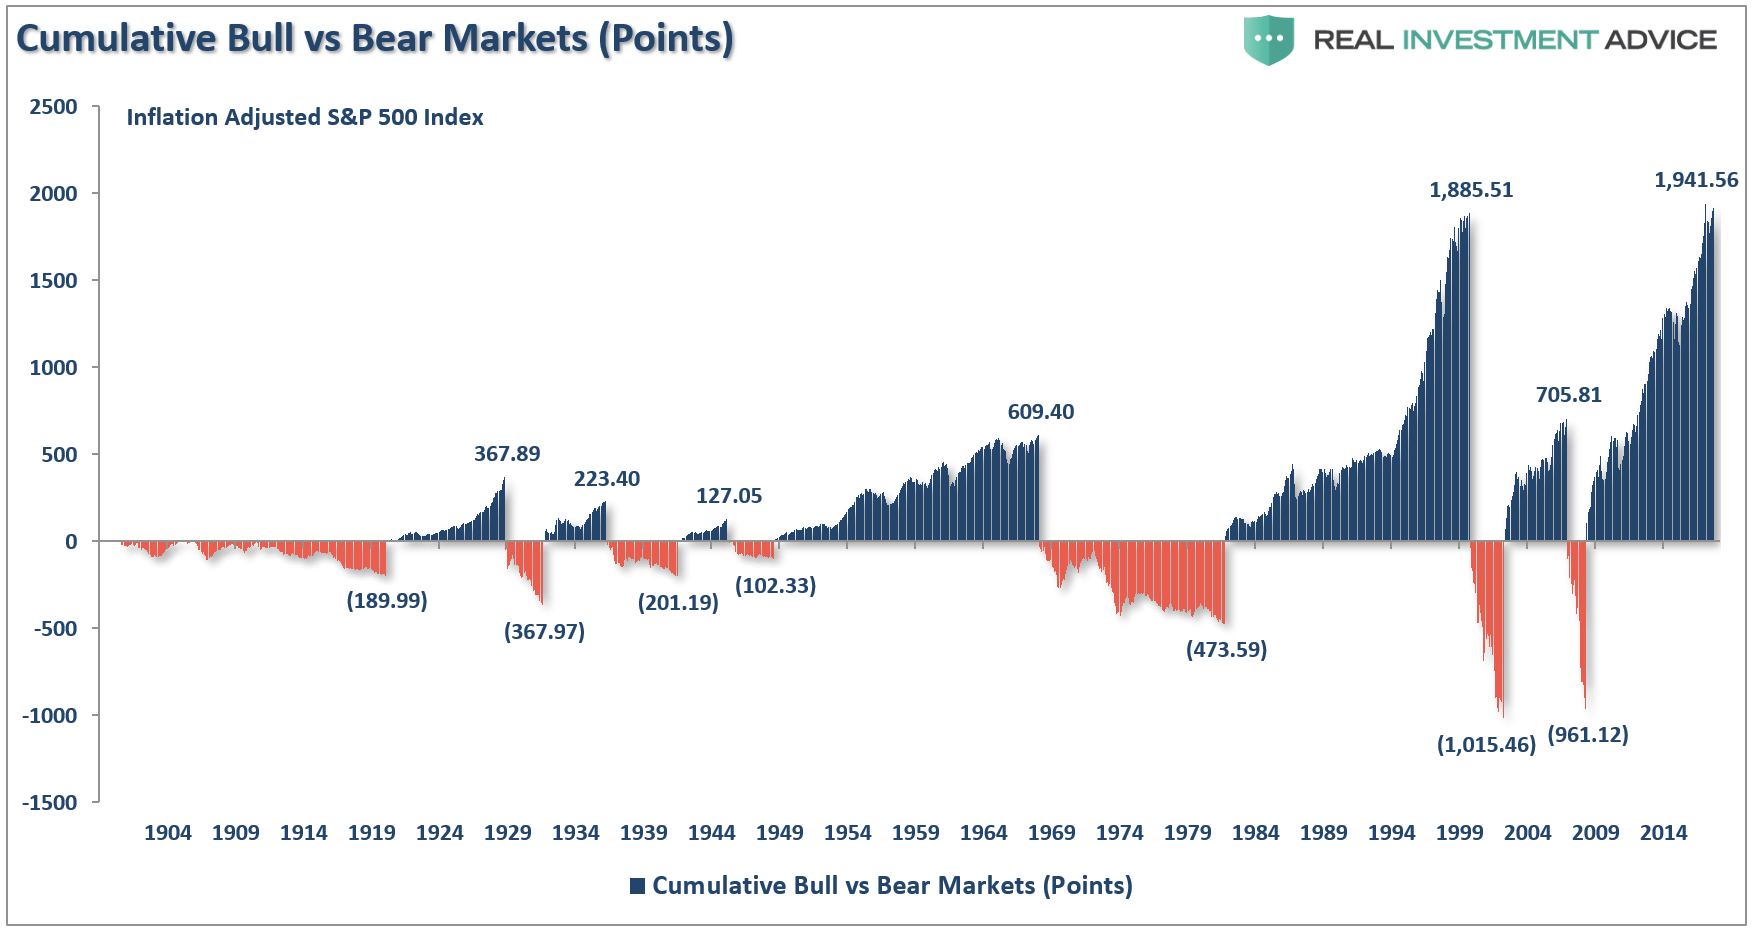
When measured in points, the damage becomes more apparent as bull markets have been almost entirely wiped out by subsequent bear markets.
The other problem, as shown in the chart below, is the lost time required to get back to even following a bear market. During these periods, wealth is not compounded and time required to achieve financial goals is lost.
(It is worth noting the entirety of the markets return over the last 118-years occurred in only 4-periods: 1925-1929, 1959-1968, 1990-2000, and 2016-present)

Since most investors only have 20 to 30-years to reach their goals, if that period begins when valuations are elevated, the odds of success falls dramatically.
Time Is An Unkind Companion
The point of “time” is critical.
While it is nostalgic to use 100+ years of market data to try and prove a point about the benefits of “buy and hold” investing, the reality is that we “mere mortals” do not have the life-span required to achieve those returns.
As I stated in my last missive:
“Despite the best of intentions, a vast majority of the ‘bullish’ crowd today have never lived through a real bear market.”
I have been managing money for people for a very long time. The one simple truth is that once an individual has lost a large chunk of their savings, they are very reluctant to go through such an experience a second time. This is particularly the case as individuals get ever closer to their retirement age.
The reader’s next comment clearly showed a lack experience in how a true bear market destroys someone’s financial, and family, life.
“Since 1950, there have 36 stock market corrections (or once every 2 years). All 36 of these stock market corrections have been completely erased within a matter of weeks and months. 36 out of 36 is a 100% success rate. Buying any major dip in the S&P 500 has been a virtual guarantee of higher returns.”
The statement is true. It just proves two points.
- If an investor had bought the lows they would have indeed garnered higher returns. However, such means the “highs were sold” and not “bought and held.” (You can’t “buy low” if you don’t “sell high”)
- A lack of understanding of the impact of getting back to even.
The purpose of investing is to:
“Grow savings at a rate which maintains the same purchasing power parity in the future and provides a stream of living income.”
Nowhere in that statement is a requirement to “beat a benchmark index.”
For most people, a $1 million account sounds like a lot of money. It’s a big, fat round number. The problem is that the end number is much less important than what it can generate. The table below shows $1,000,000 and what it can generate at varying interest rate levels.
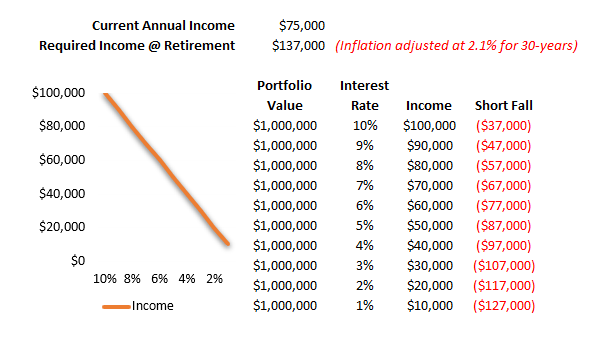
30-years ago, when prevailing rates were substantially higher, and living standards were considerably cheaper, a $1,000,000 nest egg was substantial enough to support retirement when combined with social security, pensions, etc.
Today, that story is substantially different. Again, the REASON we invest is not to “beat the market,” but rather to “grow” our hard-earned “savings” at a rate to offset inflation over time.
Let’s use an example. An individual who earns $75,000 a year in 1988 starts with a $100,000 investment. The purple line shows the portfolio value required, on an inflation adjusted basis, to replace a $75,000/per year income stream at a 3% withdrawal rate 30-years into the future. The gold line is our reader’s “buy and hold” approach. The blue line uses a simple 12-month moving average to switch from stocks to cash, and vice versa, whenever the S&P 500 breaches the average. Both charts are inflation-adjusted total return indices with $625 monthly contributions (a 10% annual savings rate).
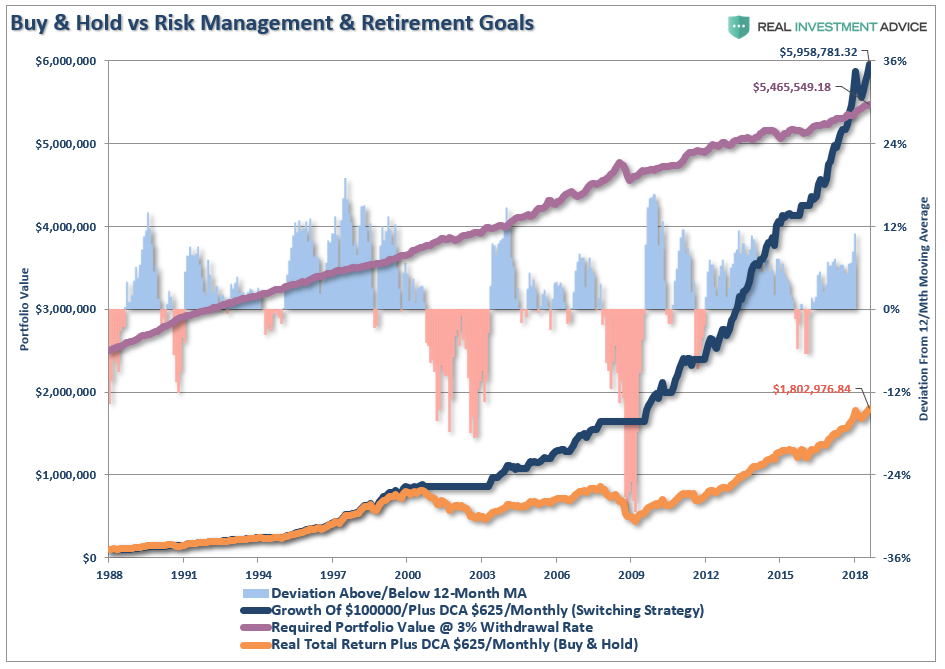
While “buying and holding” the S&P 500 index did indeed achieve a respectable outcome, spending numerous years getting “back to even” devastated the compounding effect of the portfolio. Even with “dollar cost averaging,” the benefit of three major bull market advances, and falling rates of inflation, investors were still left extremely short of their investment goals. Only by avoiding the two major drawdowns would investors accumulate enough money to fund their retirement needs.
But that statement almost always elicits two more comments: 1) You can’t time the market, and 2) active managers always underperform their benchmark.
- First, I am not a “market timer,” which is being “all in” or “all out” of the market at any given time. However, I do believe there are times I want less capital exposed to equity risk than others. Using breaches of long-term averages are just one method to determine when to have more, or less, exposure to equity-related risk.
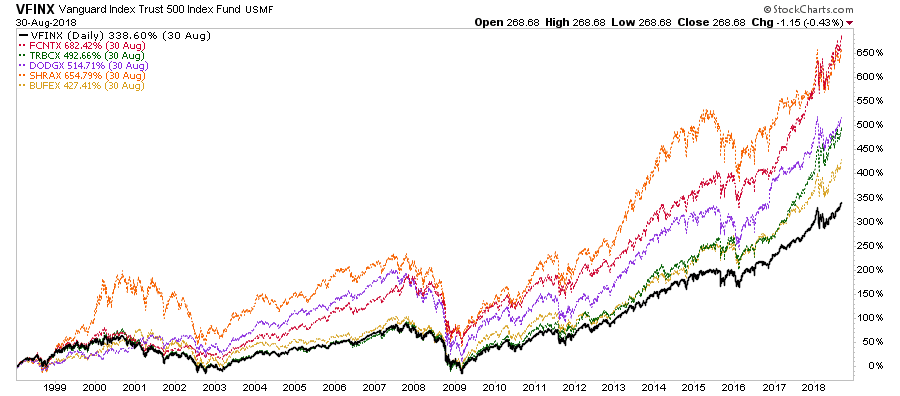
- Secondly, active managers do indeed underperform their benchmark indices from one year to the next quite often. But it is the long-term performance that is the most important. (Also, benchmark indices do not pay taxes, have expenses, operations, transaction costs, distributions, etc. which impact short-term performance.)
I quickly grabbed 5-major mutual funds and compared them to the Vanguard S&P 500 Index. Each fund manager indeed underperformed their benchmark at one time or another. They also all vastly outperformed over time.
(Note: Looking at 1, 3, 5, and 10-year records are misleading as it assumes you invested, and held, from the start of each period. If you invested at any other point, your outcome is very different.)
Let’s take the same 12-month average switching strategy mentioned above but reduce performance by 2% annually on the upside. In other words, in every up year for the S&P 500, the strategy made 2% less than the index.
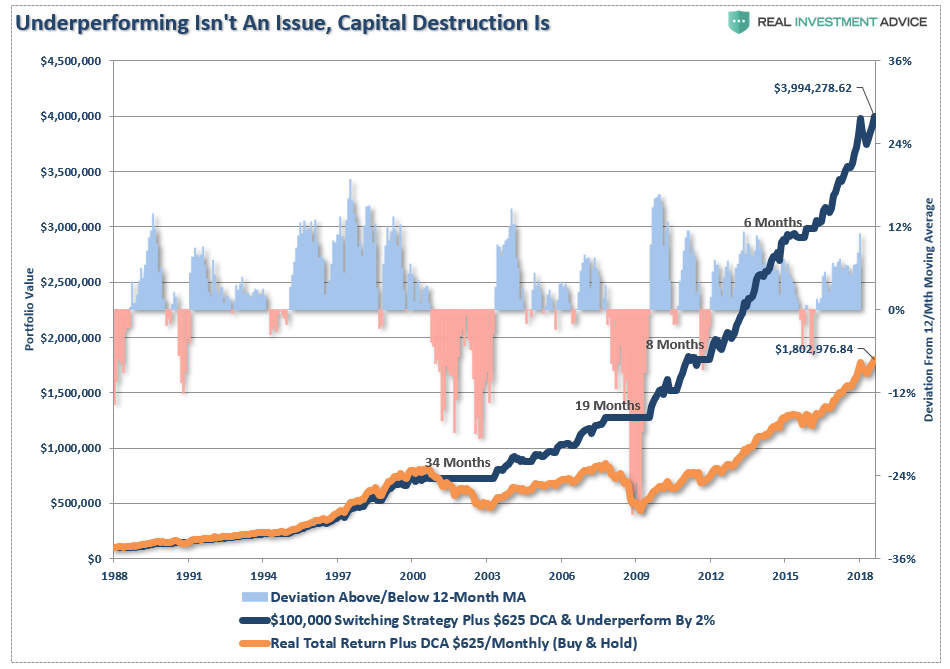
Clearly, under-performing a random benchmark index is not what investors should be concerned with.
The message is clear: “getting back to even” is not the same as “growing savings.”
Oh, yes, about those losses.
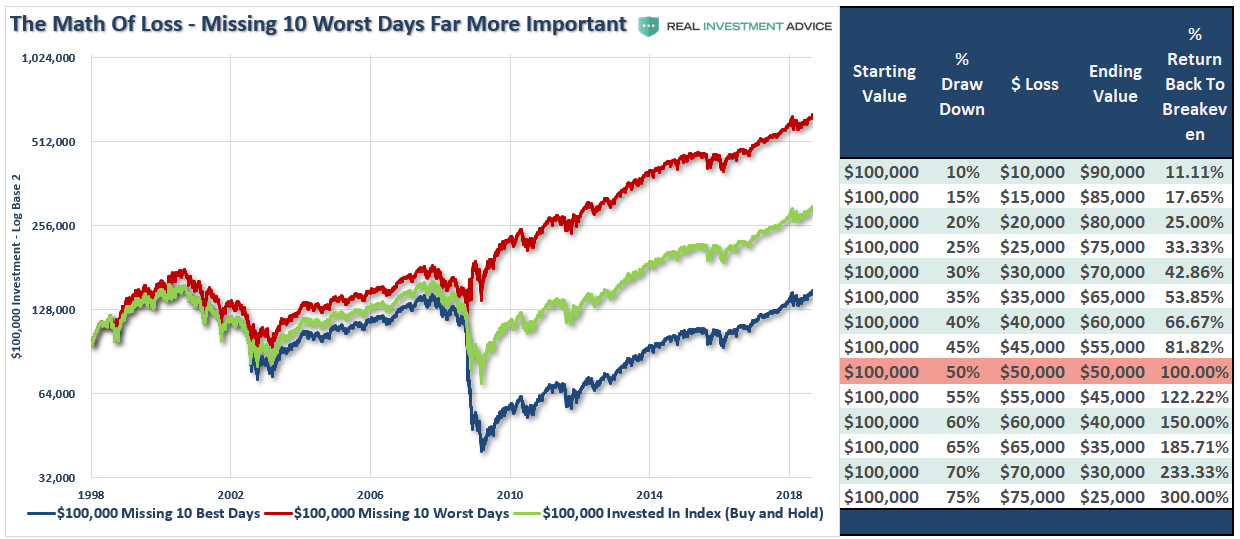
“According to a study by J.P. Morgan Asset Management, buying and holding the S&P 500 between Jan. 1, 1995, and Dec. 31, 2014, would have netted an investor a 555% return, which works out to almost 10% per year. But missing just the 10 best days out of this more than 5,000-day trading period would have returned only 191%, less than half. If you missed a little more than 30 of the best trading days, your gains would have completely disappeared.”
While that statistic is often bantered about, it is “missing the losses” that are far more important to returns.
Where You Start Determines Where You End
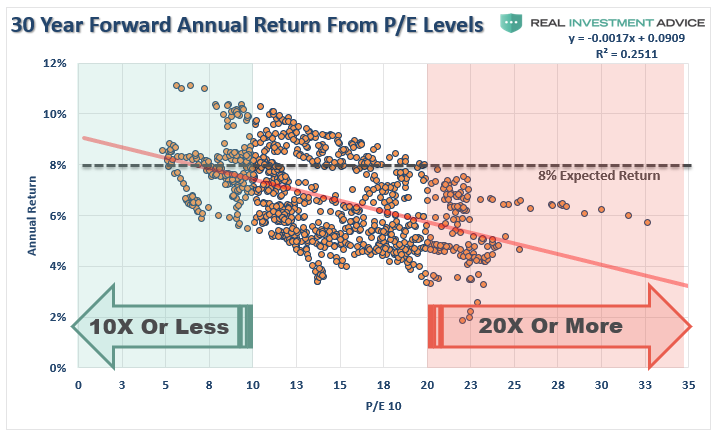
As we have discussed previously, it is the starting level of valuations which are most important. Today, those valuations are the second highest level on record.
“What is clear, and unarguable, is that when valuations are elevated, future returns on investments decline. There are two ways in which the ratio can revert back to levels where future returns on investments rise. 1) Prices can rapidly decline, or 2) Earnings can rise significantly while prices remain flat. Historically, and as shown above, option 2) has never been a previous outcome.“
While such isn’t a hard concept to understand, in the rush to make a point about “buy and hold” investing, statements like the following are made:
“Timing is irrelevant, it’s all about TIME IN the market. But WAIT. it gets even Better.-The 500 Index has had ZERO negative 20-year periods, while averaging 10%;-Out of all Rolling 5-Year periods since 1954, only 7 of them have been negative, the worst one was -2.4% (1974).”
That point is only true if you don’t adjust for the impact of inflation over time. However, once you add inflation into the calculation, a far different picture emerges.
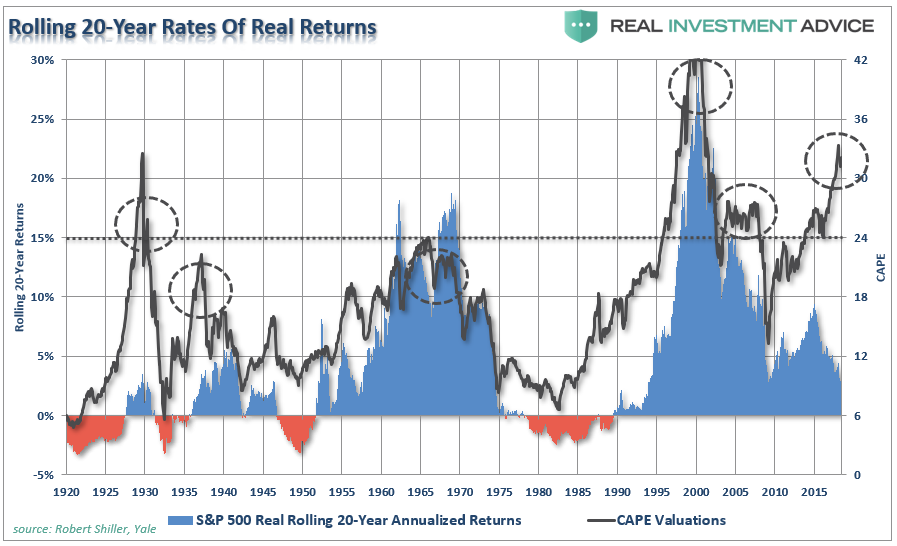
But, we also need to include dividends to be factually correct. Even on a 20-year real total return basis, there was a negative return period. But while the three other periods were not negative after including dividends, when it comes to saving for retirement, a 20-year period of 1% returns isn’t much different from zero.
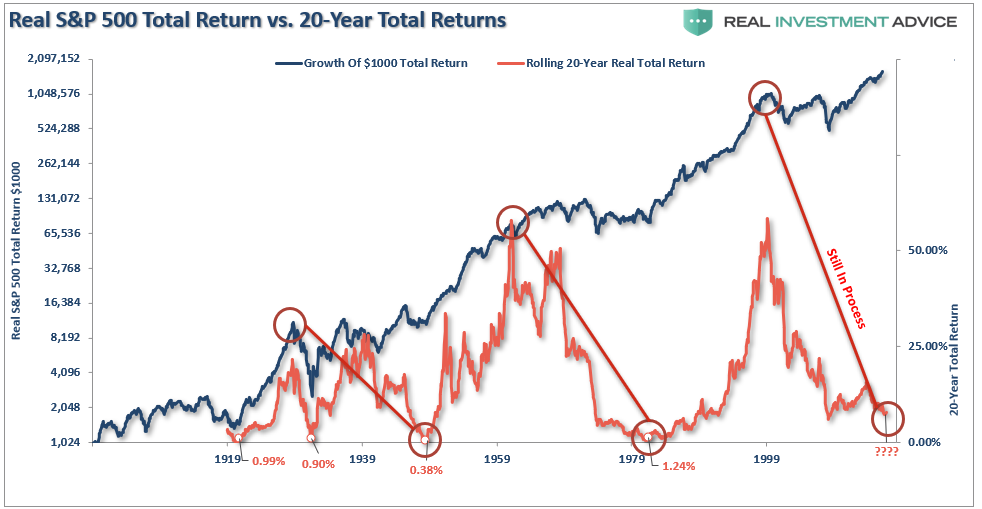
Unfortunately, we are just mere mortals, and using 100+ years of market data misses the real point.
As stated above, the single most important ingredient to investing success is the level of valuations at the start of your journey.
There are many investors today who started investing after the “financial crisis.” Also, there are over 13-million newly minted financial advisors who have never seen a “bear market.”
I have lived through several bear markets in my career and have learned to have great respect for what markets can do to portfolios, retirement plans, and families lives.
You can’t time the market? I agree.
However, you can manage the risk.
Every great portfolio manager over time from Warren Buffett to Ben Graham had one simple concept in managing money – “buy low, sell high.”
Not one of them ever practiced “buy and hold” as an investment strategy.
If they didn’t. Why should you?
Currently, with the bull market now the longest on record, monetary policy becoming more restrictive, and valuation levels at the second highest level in history – starting your investment process today is likely going to have similar results over the next 20-year period as we have seen throughout similar periods in history.
Such is how all cycles end, and at the extremes, opposing views are always disregarded.
“People don’t want to hear the truth because they don’t want their illusions destroyed” – Fredrich Nietzsche


