In this blog, we will take a look at the Elliott Wave view of the Euro Stoxx Index in a weekly time frame to determine the timing for the pull back in FTSE Index to end and the timing to buy the World Indices.
Euro Stoxx Elliott Wave Analysis -Weekly Time Frame
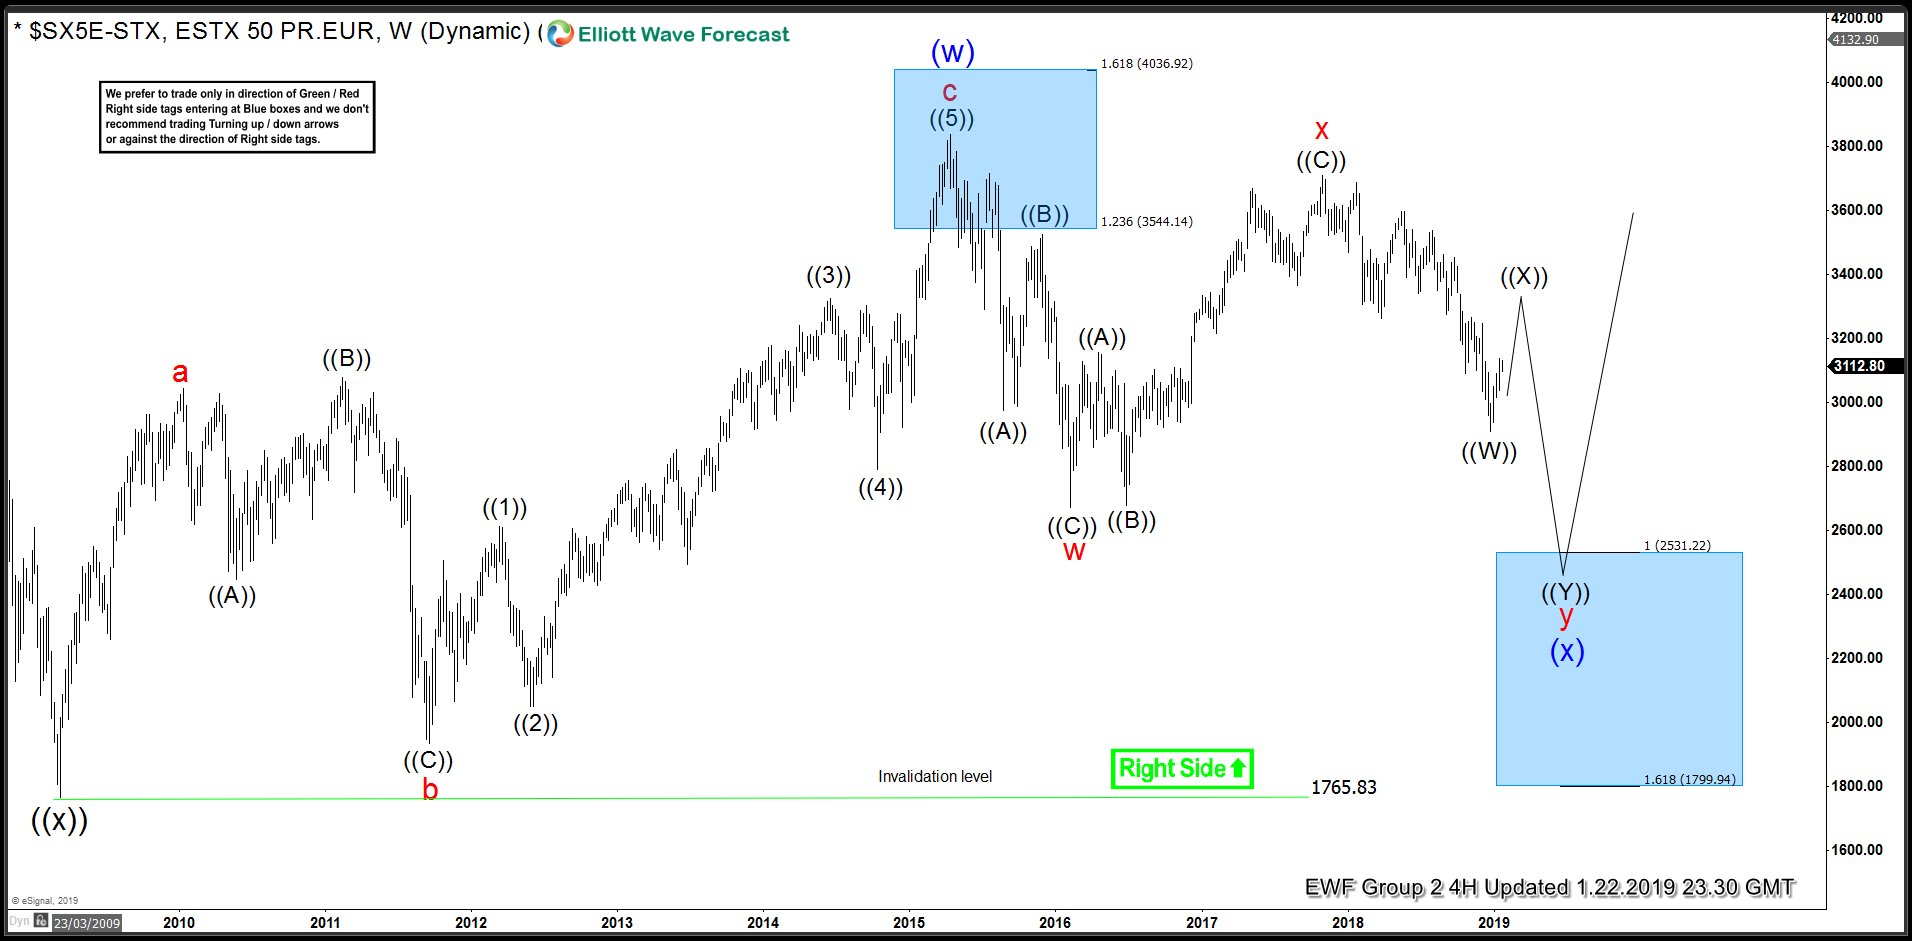
The Euro Stoxx rally from March 2009 low to April 2015 peak was a 3 waves move that we have labelled as an Elliott wave zig-zag structure. A zig-zag is an “abc” structure in which wave “a” is in 5 waves, wave “b” is in 3 waves and wave “c” is also in 3 waves. This was followed by a 3 waves drop to 2672 in February 2016. Following this drop, Index tried to resume the rally but failed below April 2015 peak and started dropping again. Rally from February 2016 low to October 2017 peak unfolded as an Elliott wave FLAT structure and since then the Index has dropped again in 3 waves so far. Even when Index has not yet broke below February 2016 low, our proprietary distribution system is telling us that the pivot at February 2016 low has given up which means that level is likely to break and open extension lower toward 2531.22 – 1799.94 area.
As pivot at February 2016 low has given up, the current bounce in wave (( X )) is expected to fail and find sellers in 3,7 or 11 swings and decline should then resume as far as pivot at October 2017 peak remains intact. We know already that FTSE is correcting the cycle from 2009 low and Eurostoxx Index is doing the same. As Euro Stoxx didn’t break above 2015 peak, it provides us with a clear floor on the down side and this floor comes between 2531.22 – 1799.94. Once this area is reached, ideally FTSE and rest of the World Indices should also finish their pull back and find buyers to resume the rally for new highs or at least a larger 3 waves bounce.