Based on the August 8th, 2017 Oil Investment Update
In the previous month crude oil gained almost 9% as declines in crude oil, gasoline and distillates inventories continued to support the price of the commodity. In that environment light crude climbed above the psychologically important barrier of $50 and closed July above it. Despite this bullish development, the price of the black gold slipped below it at the beginning of August. Is this just a bigger pullback or the first sign of a longer downward move? Is it possible that the oil-to-gold and oil-to-silver ratios give us more clues about crude oil future moves?
Relationship between Crude Oil and Gold
Let’s start today’s essay with the long-term picture of the oil-to-gold ratio (charts courtesy of http://stockcharts.com).

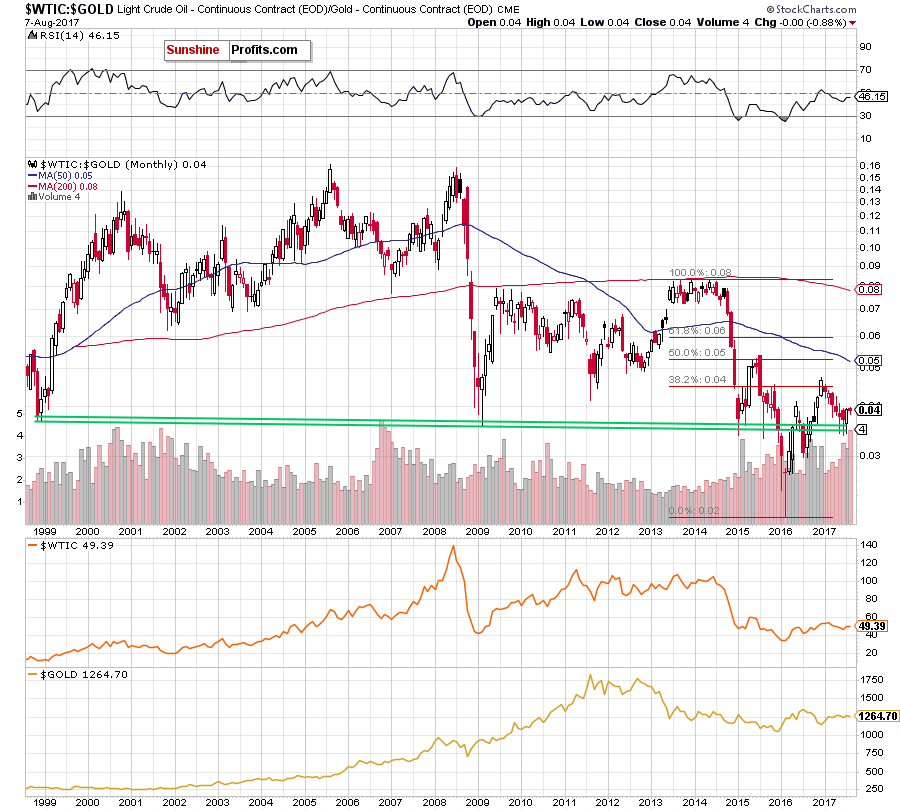
Looking at the chart from the long-term perspective, we see that the overall situation hasn’t changed much as the ratio is trading in a narrow range between the May high and low, slightly above the long-term green support lines, which stopped the bears three times in the previous months. Such situation suggests that as long as there is no breakdown and a monthly closure below this support zone another sizable move to the downside is not likely to be seen.
But will we see a test of the recent lows in the coming weeks? Let’s take a closer look at the weekly chart and try to find the answer.
In our crude oil essay posted on July 31, we wrote the following:
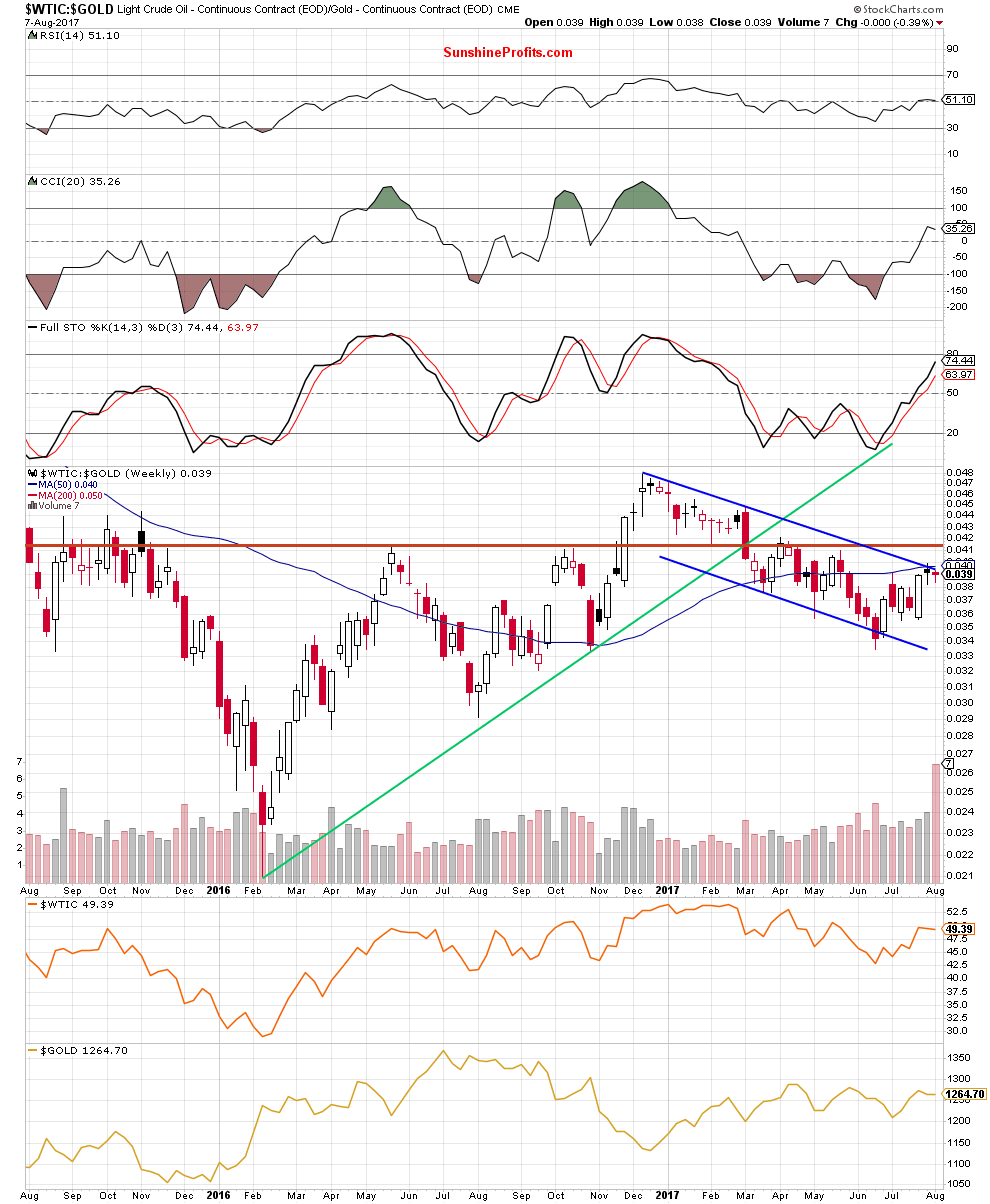
(…) From the weekly perspective, we see that even if the ratio moves higher one again, very close to the current levels we can notice the upper border of the blue declining trend channel, the 50-week moving average and the July peak, which together could stop bulls and trigger a reversal and declines in the coming week.
From today’s point of view, we see that the situation developed in line with the above scenario and the above-mentioned resistance area paused oil bulls in the previous week. As a result, the ratio closed the whole week under the upper border of the blue declining trend channel and the 50-week moving average, invalidating the earlier tiny breakout.
Such price action is a negative development, which suggests that further deterioration may be just around the corner. How such price action could affect the price of crude oil? We believe that the best answer to this question will be the quote from our oil essay posted on July 31:
(…) Taking into account the fact that positive correlation between the ratio and the commodity is still in cards, we believe that declines in the ratio will likely translate into lower prices of crude oil in the coming week(s).
Relationship between Crude Oil and Silver
This pro bearish scenario is also reinforced by the current situation in the oil-to-silver ratio.
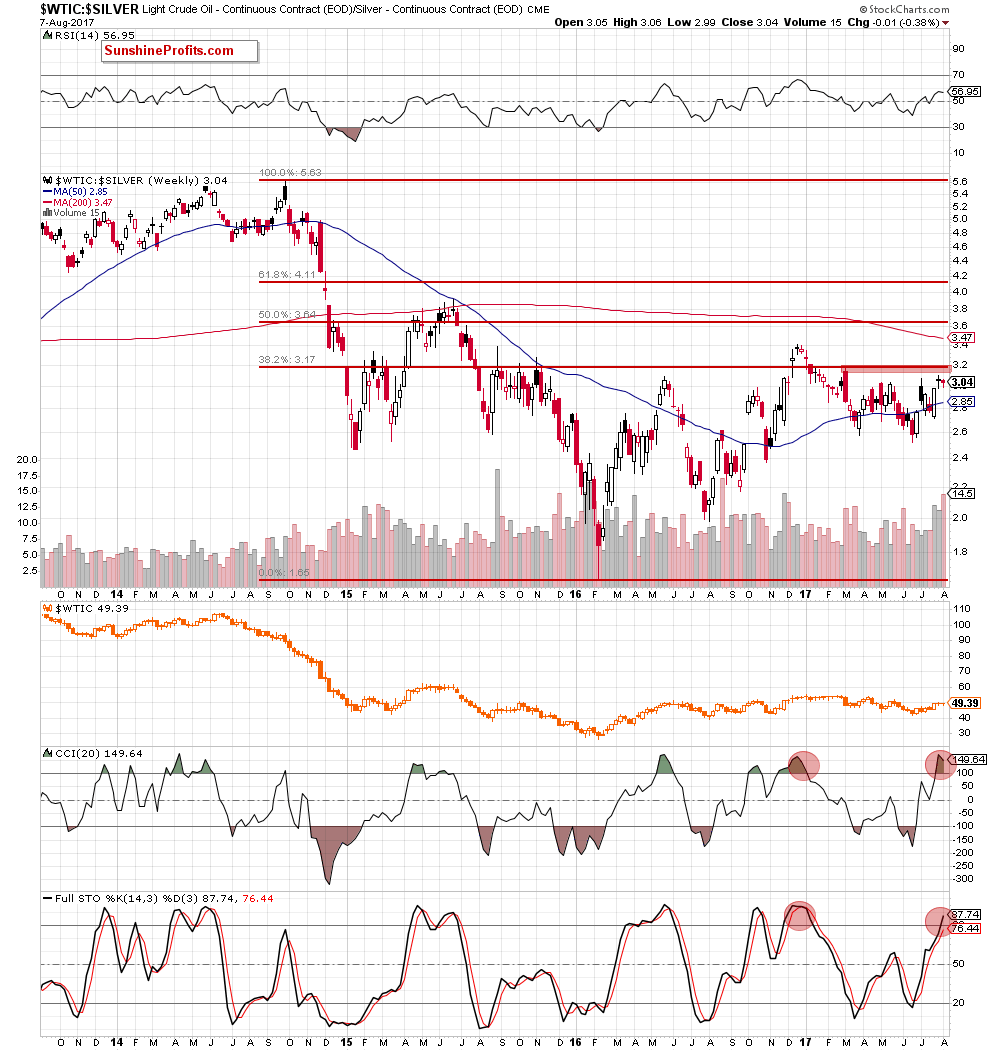
As you see on the medium-term chart, the recent rebound took the ratio to slightly below the red resistance zone created by the March peak and the 38.2% Fibonacci retracement based on the entire September 2014-February 2016 downward move, which could stop the bulls and further improvement in the ratio (and also crude oil) in the coming week(s).
Summing up, as you saw at the above charts the positive correlation between both ratios and the commodity is still in cards, which suggests that declines in the oil-to-gold and oil-to-silver ratios will likely encourage oil bears to act and translate into lower prices of crude oil in the coming week(s).
The above article is based on our latest Oil Investment Update. Its full version includes much more details and is accompanied by scenario analysis and summary of key factors that are likely to affect crude oil in the coming weeks. If you enjoyed it, we encourage you to sign up for Oil Investment Updates or the Fundamental Package that includes it.
Thank you.
Nadia Simmons
Forex & Oil Trading Strategist
Oil Investment Updates
Oil Trading Alerts


