Actionable insights straight to your inbox

Equities logo

Cheesecake Factory: Sequence Calling for More Upside

?In today's blog, we examine the stock from a technical angle.
ElliottWave-Forecast has built our reputation on accurate technical analysis and a winning attitude. By successfully incorporating the Elliott Wave Theory with Market Correlation, Cycles, Swing sequences, Distribution system and the Right Side system which consists of Right Side tags to inform clients of what side of the market should be traded and blue boxes to show areas for buying / selling. We provide precise forecasts with up-to-date analysis for 78 instruments including Forex, Commodities, ZN (10 year note yields), World Indices, Stocks, ETFs and Bitcoin.

In today’s blog, we will have a look at the latest moves in The Cheesecake Factory CAKE stock.

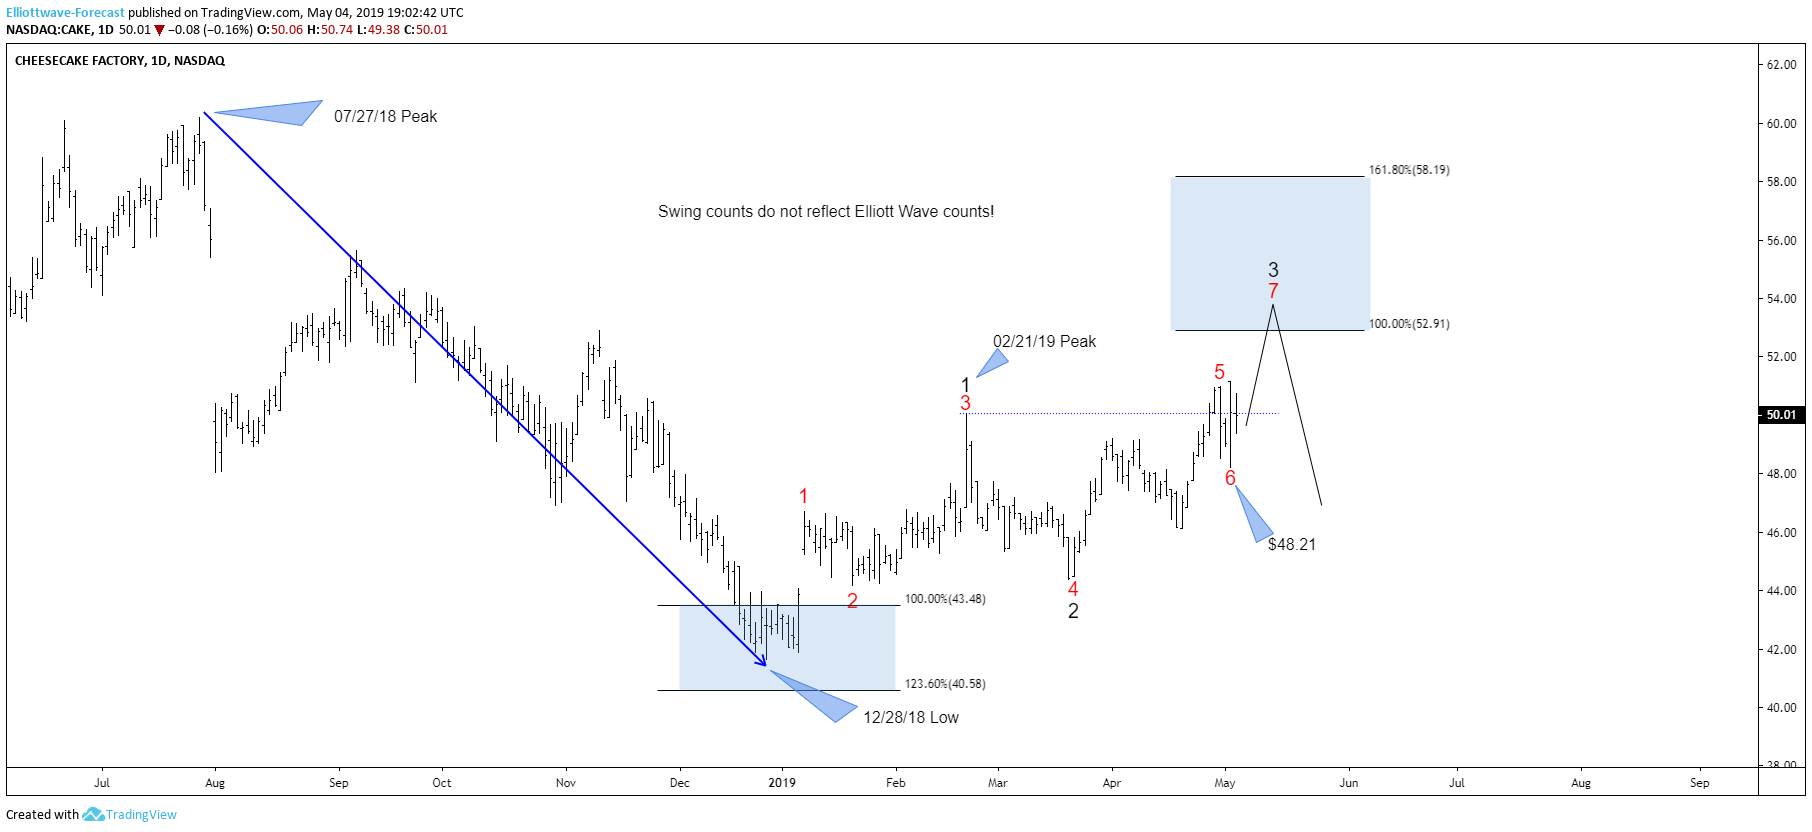
The company released its first-quarter earnings last week. Revenue came in at $599.48 million, missing the consensus estimate of $602 million. Adjusted earnings per share were $0.62, however, beating the expectations of $0.60, driving the stock to a new high. Below you can see the daily chart of Cheesecake Factory. The stock ended the cycle from the 7/27/18 peak at the 12/28/18 low, with a correction of the cycle above from there.

With the new spike higher after the earnings release, it managed to break above the 2/21/19 peak making it a 5-swings incomplete sequence from its 12/28/18 low, opening up an extension higher. As long as the stock stays above the 6th swing low of $48.21, it should ideally trade higher into the blue box area towards $52.91-$58.19. This coincides with the identical cycle in the world indices.

The Cheesecake Factory 05.04.2019 Daily Sequence Analysis

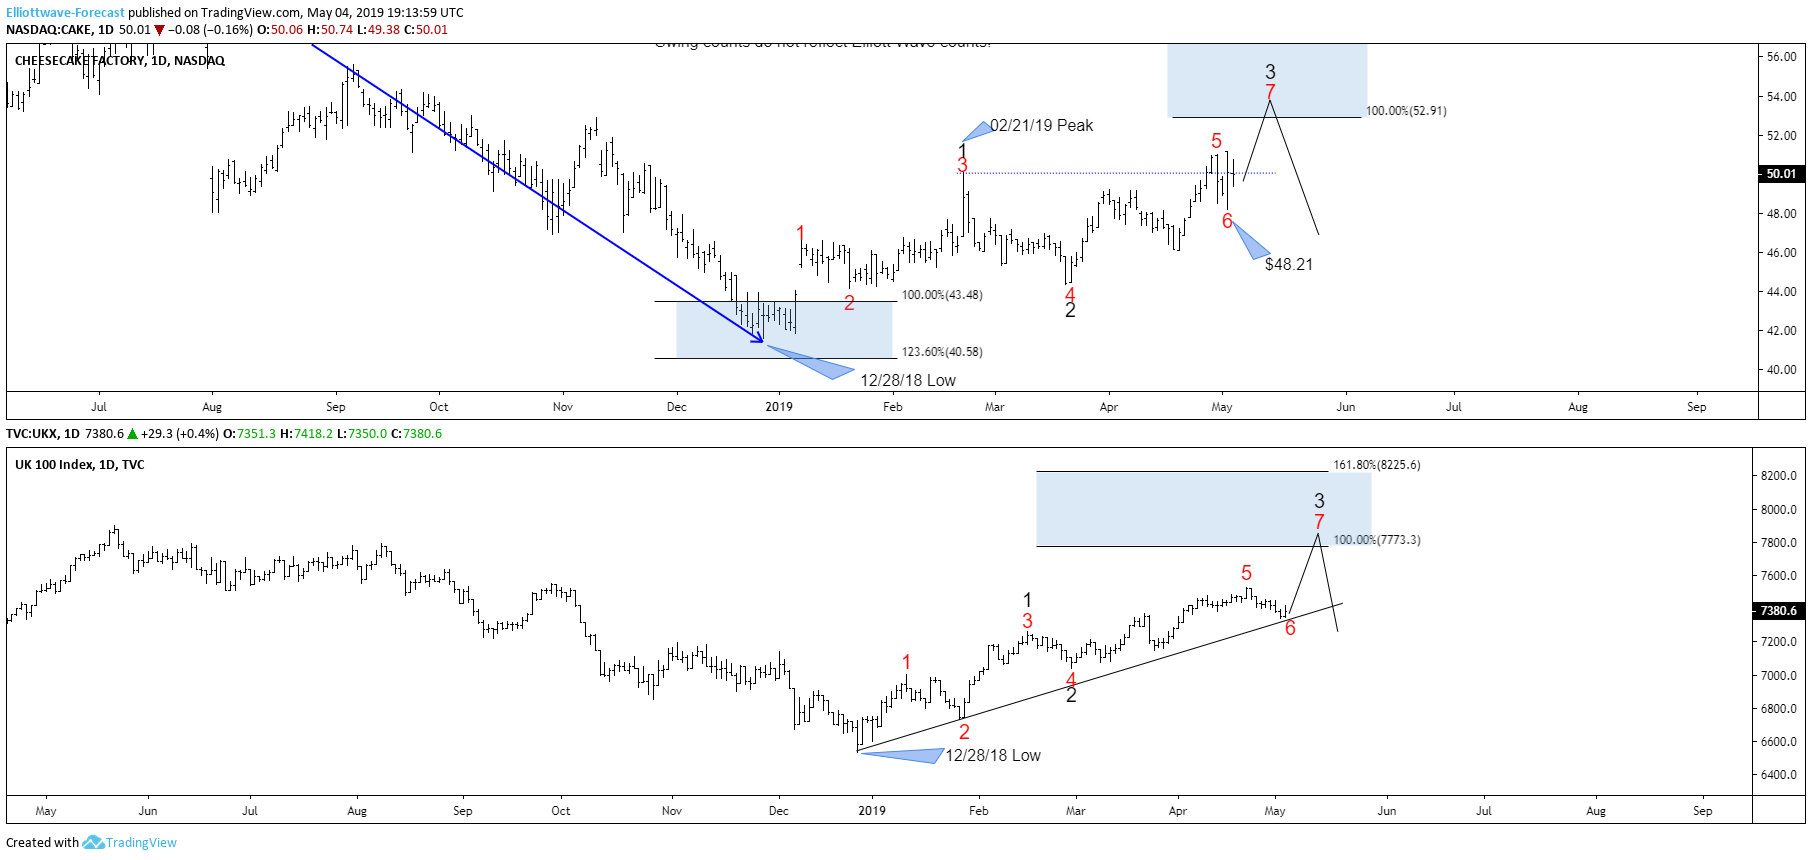
In the last chart, you can see nicely that the FTSE 100 Index is trading within the same cycle as Cheesecake Factory stock and has an incomplete sequence to the upside based on the “One Market Only” concept. This can also be the first indication that the stock could potentially trade higher as well into its respective equal legs area.

The Cheesecake Factory vs FTSE 100 05.04.2019 Sequence Analysis

Cheesecake Factory vs FTSE 100

I hope you liked this blog and I wish you all good trades.

I’ve long said we are under-utilizing nuclear energy. This shouldn’t be controversial; nuclear has something for everyone.