In these times of increased stock market volatility, investors are invariably looking to take a more defensive stance, viewing the preservation of capital as a higher concern than making profits. Utilities tend to be one of the sectors that defensive-minded investors tend to flock to as it has a good track record when markets come under pressure:
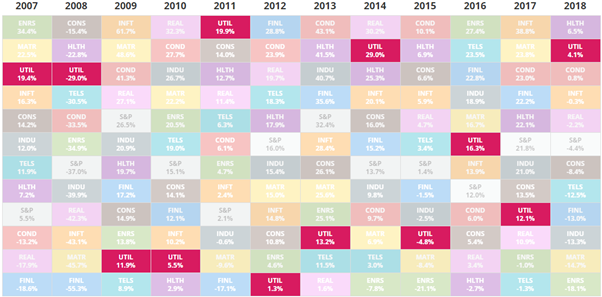 Image Source: novelinvestor.com
During turbulent years (2007-8, 2011, 2014, 2016 and 2018) utilities were among the top performers (although “top” was a subjective term in 2008 when the best sector lost 15%). A chart showing the trailing 1-year correlation for the SPDR Utilities Sector ETF (

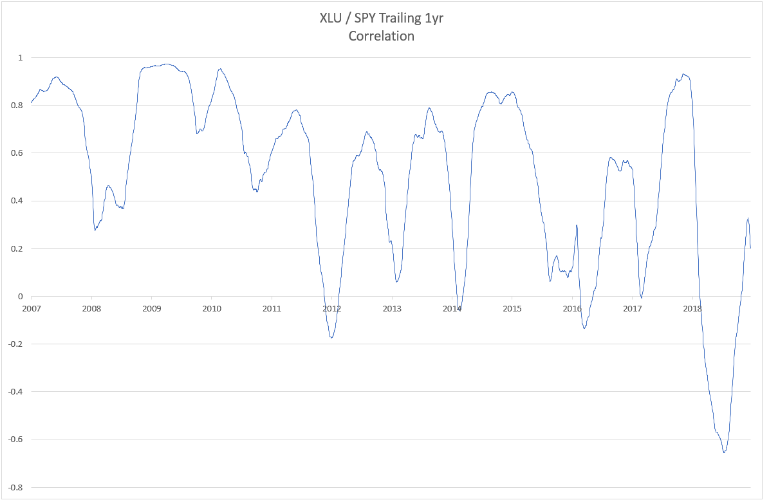 Image Source: Factset, InvestorsEdge.net
Examining the SPDR ETFs show us that the utilities sector is historically the least correlated with the SPY by quite a large margin:
|
Sector |
Mean Correl |
Median Correl |
|
Technology Sector (XLK) |
0.90 |
0.95 |
|
Industrial Sector (XLI) |
0.86 |
0.95 |
|
Consumer Discretionary Sector (XLY) |
0.81 |
0.93 |
|
Financials Sector (XLF) |
0.80 |
0.92 |
|
Health Care Sector (XLV) |
0.79 |
0.84 |
|
Materials Sector (XLB) |
0.73 |
0.90 |
|
Consumer Staples Sector (XLP) |
0.62 |
0.78 |
|
Energy Sector (XLE) |
0.62 |
0.78 |
|
Utilities Sector (XLU) |
0.50 |
0.65 |
Source: Factset
So, during times of stock market stress stocks in the utilities sector have shown strong returns, whilst the opposite is true during quieter times. The same was true in 2018, where an investment in the XLU would have looked like this:
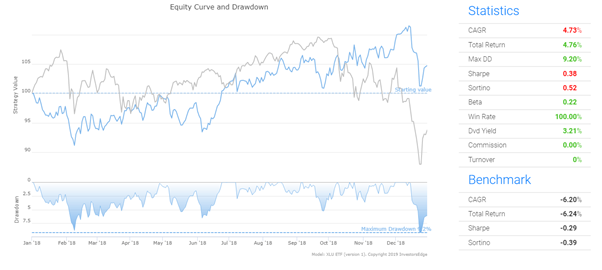 Image Source: InvestorsEdge.net
Not a bad performance when the S&P 500 dropped by 6% over the same period. Indeed, buying and holding the XLU from the turn of the century would have beaten the benchmark by a healthy margin, with an average total return of 5.75% annually compared with the benchmark’s nominal 2.85% return (or 4.1% after dividends):
Image Source: InvestorsEdge.net
While the performance is better than the S&P 500, 5.75% is hardly a return that will have many of us jumping up and down in excitement about. What we need is to find a strategy for picking utility stocks that performs well in bull markets and insulates us from market corrections.
A Simple Strategy to Select Winning Utilities
I’ve been researching the factors that can differentiate a utility that will rise in value from one that will underperform the market and have hit upon two main factors that have historically demonstrated some predictive power that we can utilize. All my research was undertaken using used the InvestorsEdge.net platform.
The first factor, Price to Cash Flow was an obvious inclusion in our screen – a company that generates lots of cash relative to its price could be a gem that the market has mispriced. Alternatively, and more frequently, this forecasts an imminent drop in cash flows and the reversion of the ratio to more normal levels so what you need is one or more other factors to confirm the company’s quality.
The second factor that I uncovered is the ratio of Research & Development to Gross Income. Utilities with the lowest R&D as a percentage of income tend to perform better than their peers, especially those that report a zero figure for their R&D expenditures.
This ratio performs well because utilities are typically seen as cash flow generators and anything that risks that income stream (such as expensive R&D projects) is seen by investors as a negative. In other words, investors like their cash cows to be nice and boring.
Introducing the Boring Utility Strategy
In August 2018 I created my Boring Utility Strategy which incorporated these and a handful of other factors. The strategy itself performed well in historical backtests whilst insulating us from the worst effects of recent market correction:
Image Source: InvestorsEdge.net
The above logarithmic chart shows the strategy significantly outperforming its S&P 500 benchmark over the last 30 years, with a lower drawdown (44% compared to the S&P’s 57% drop). Gains were 75% capital with the remainder coming from dividends. The strategy also exhibits very low turnover, only making 783 trades over the 30-year period.
How the Strategy Works
The strategy itself is very simple, rebalancing monthly and selecting as its universe of potential stocks all US shares and depository receipts in the Utilities sector with a market capitalization of $250m or greater.
At the end of each month the system ranks each security based on their:
- R&D to Gross Income ratio (50% weighting)
- Price to Cash Flow ratio (40% weighting)
- 6-month price momentum (4% weighting)
- 12-month price momentum (4% weighting)
- Payout Ratio (2% weighting)
The strategy then buys the 10 stocks with the highest combined rank and holds them for a minimum of a month.
The Risks
There are a number of risks involved in following any trading strategy, and my Boring Utilities model is no exception. Chief amongst these risks are:
Market Corrections
The whole aim of developing this strategy has been to try to harness the utilities ability to insulate us from market corrections, and from 2000 onwards it has done exactly that.
Curve fitting
Curve fitting occurs when we mine a data source to find a pattern that exists in history but won’t repeat itself in the future. This is probably the most common reason that mechanical investing strategies fail, and to combat this we need to develop and test our models using data from multiple time frames. This strategy was developed using data from 2011-16 and then tested on numerous time slices over the last 30 years.
Another important sense check to prevent curve fitting is to understand the economic reasons why the pattern you’ve found works. In this case, we are buying companies that exhibit lower risk (i.e. low R&D spending and payout ratios) that have been underpriced by the market yet have shown recent upwards price momentum – to me, these are perfectly sound and logical reasons to prefer the selected companies over their peers.
The Anomaly Stops Working
Sometimes we find a pattern in the data that can be rationalized and continues working for a time, only to fail at a later date. Sometimes this is because the phenomena become widely used and cease to be profitable, other times because it was a short term effect that just stops repeating itself.
This is where the availability of backtest data over lengthier periods can help set your mind at rest, as if the pattern you have identified has existed for 30 years then you can be more confident that it will continue.
Your Takeaway
The Boring Utility Strategy has been designed to both leverage the ability of securities in the utilities sector to cushion us from market corrections and to provide both capital gains and income during the good times.
If you were to start using this strategy today, the strategy would suggest opening positions in the following utilities:
| PG&E Corporation ( |
| AES Corporation ( |
| Portland General Electric Company ( |
| Exelon Corporation ( |
| Korea Electric Power Corporation Sponsored ADR ( |
| Atlantic Power Corporation ( |
| Clearway Energy ( |
| Companhia Paranaense de Energia Sponsored ADR ( |
| CenterPoint Energy, Inc. ( |
| Suburban Propane Partners, L.P. ( |
For those of you who would like to see more statistics, you can see further charts together with a historical list of positions and dividends here.


