BlackRock Breaking Higher After Earnings, What’s Next?
BlackRock is the world largest asset manager with over $6.5 trillion in assets under current management. The company released first quarter earnings last week, reporting $65 billion of quarterly total net inflows – 4% organic
asset growth – positive across index, active and cash
management strategies. Revenue came in at $3.35 billion, slightly higher than expectations of $3.33 billion. Adjusted EPS of $6.61 beat expectations of $6.12. The results drove the stock to break its 03/01/19 peak, making the right side higher against the $412.80 low which can be seen in the chart below.
BlackRock 04.17.2019 4H Sequence Analysis
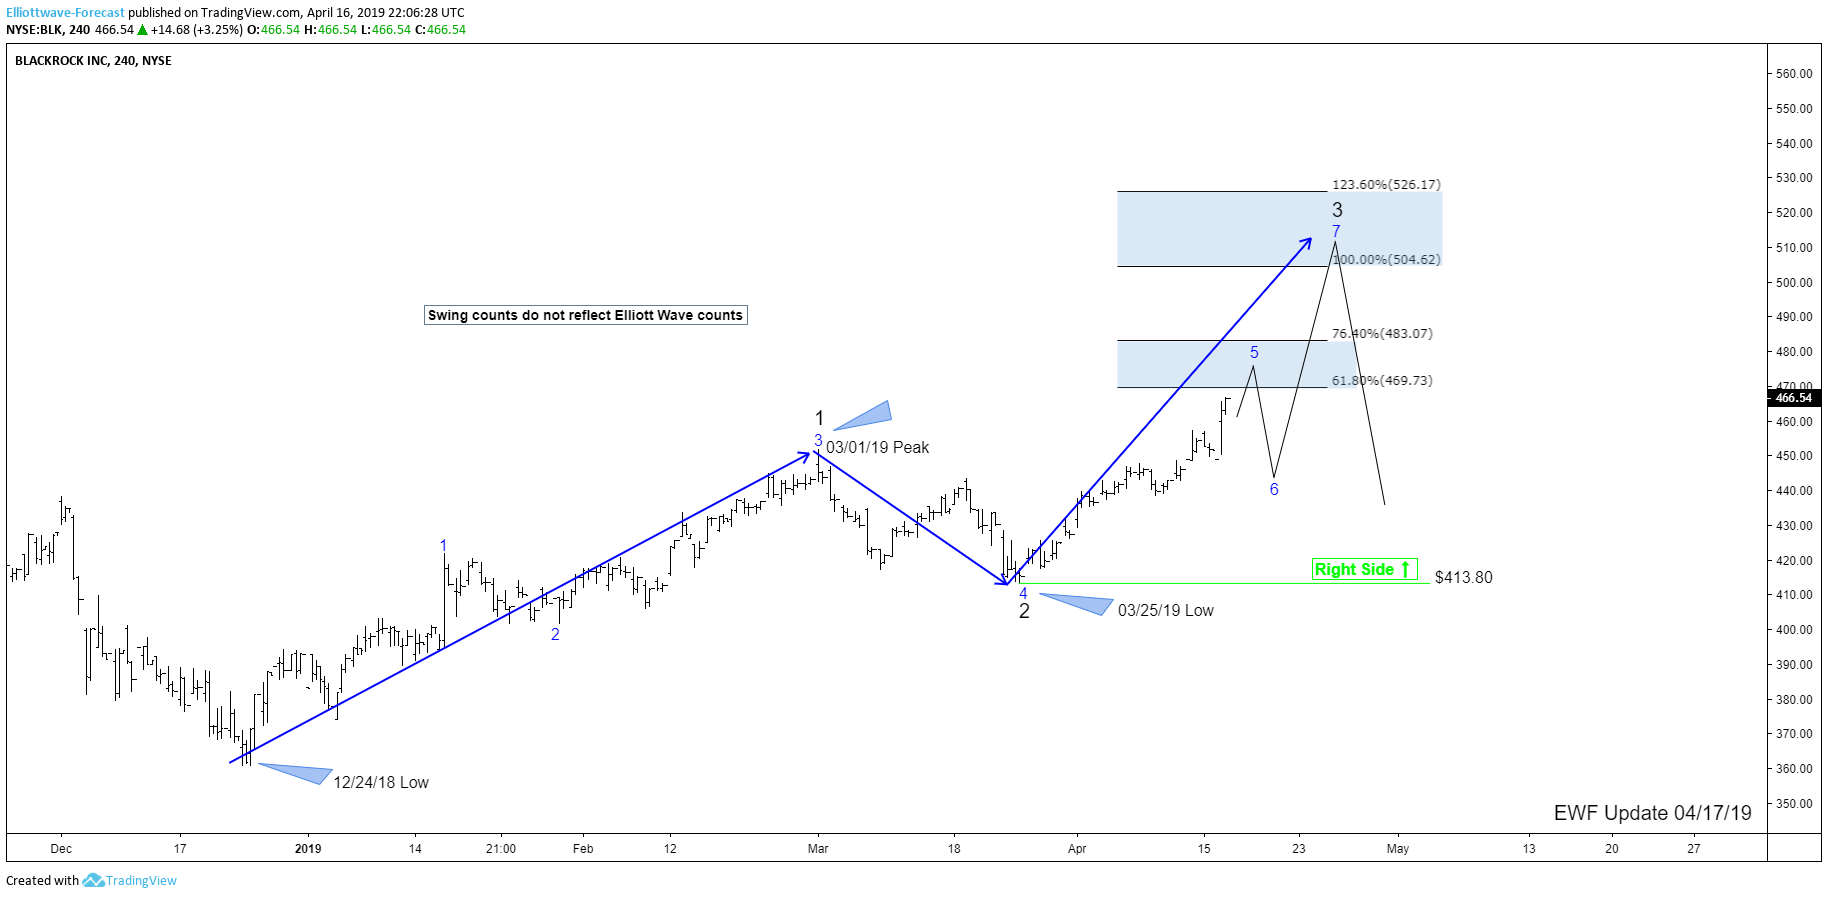
The move higher makes a 5-swing incomplete bullish sequence from the 12/24/18 low. Ideally, BlackRock should see the $467.73-$483.07 area, which is the 0.618-0.764 Fibonacci extension area from its 12/24/18 lows. Within that area, it is expected to end the 5th swing followed by a pullback in swing 6, before another extension higher into the initial equal legs should be seen.
The target area of the equal legs extreme comes at around $504.62-$526.17, where a bigger reaction lower is expected to take place and also to end the 7th swing. For now, any pullback against the 03/25/19 low should find buyers at the sequences of 3-7 or 11 swings, targeting the equal legs area.


