
The latest Australian Bureau of Statistics Residential Property Price Report suggests house prices eased in most capital cities in the March quarter. This note provides an update on my house price valuation estimates. It suggests that while Sydney property remains relatively overvalued, several other capital cities now appear relatively cheap. Importantly, however, overall Australian house prices are not that expensive given the current level of interest rates.
Australian House Price Valuations
According to the ABS, the nation-wide value of “established” house prices (i.e. those on their own plot of land), fell by 0.8% in the March quarter, to be up only 2.2% over the past year. That marks the first quarterly national house price decline since the September quarter 2012, and the largest quarterly price decline since the September quarter 2011.
As seen in the chart below, the national house-to-income ratio* appears to be peaking at levels well above past peaks in 2008 and 2010. That said, allowing for today’s still relatively low level of variable mortgage interest rates, mortgage servicing costs in the March quarter were around 30% of after-tax household income, only a little above their long-run average (since 1993) of 26%. In other words, most of the gain in house prices in recent years has reflected underlying growth in household income and, most importantly, the decline in interest rates.
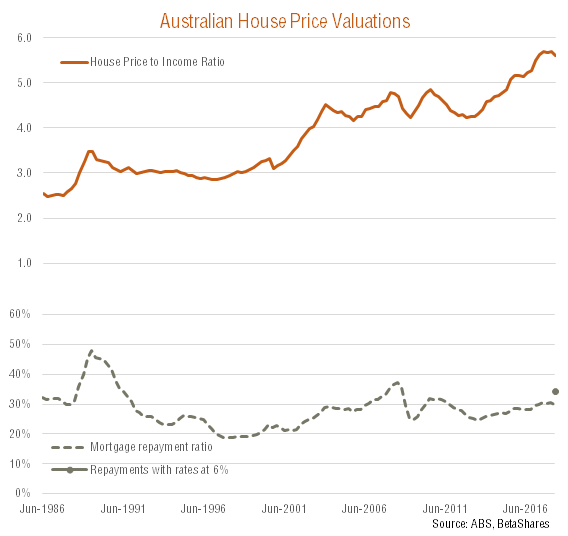

Of course, many would note that interest rates remain unusually low, which is arguably helping to hold up house prices. By way of example, if mortgage rates lifted to near their average over the low inflation period since the mid-1990s (i.e. to, say 6% from 4.5% presently), this measure of mortgage servicing costs will increase to 34.6%. That would be even further above average, but still below the level achieved in mid-2008 when mortgage rates hit 8.9%. Even though interest rates were cut thereafter as the GFC hit Australia in late 2008, house prices still declined over the following year.
Capital City Trends
The once red-hot Sydney property market has led national house price declines in recent quarters, while the once relatively cheap Hobart markets has boomed. Sydney established house prices declined by 1.4% in the March quarter to be 2.9% below their recent peak in the June quarter 2017. Prices in Hobart, by contrast, surged by 4.9% in the March quarter, to be up 14.6% over the past year.
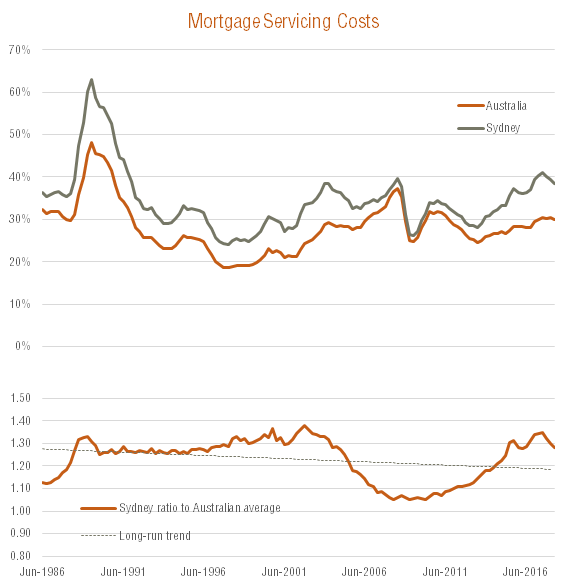
As seen in the chart below, the Sydney market has begun to roll over at a similarly high level of mortgage servicing costs as evident in its previous peaks in 2004 and 2008 – suggesting (un)affordability, even in the absence of higher mortgage rates, has been the major driver of the correction to date. This ratio also suggests the Sydney market has further to adjust before it could be considered back to average affordability levels, much less somewhat cheap. Indeed, the ratio of Sydney mortgage servicing costs to the national average remains somewhat above long-run trend levels.
 Source: ABS, BetaShares
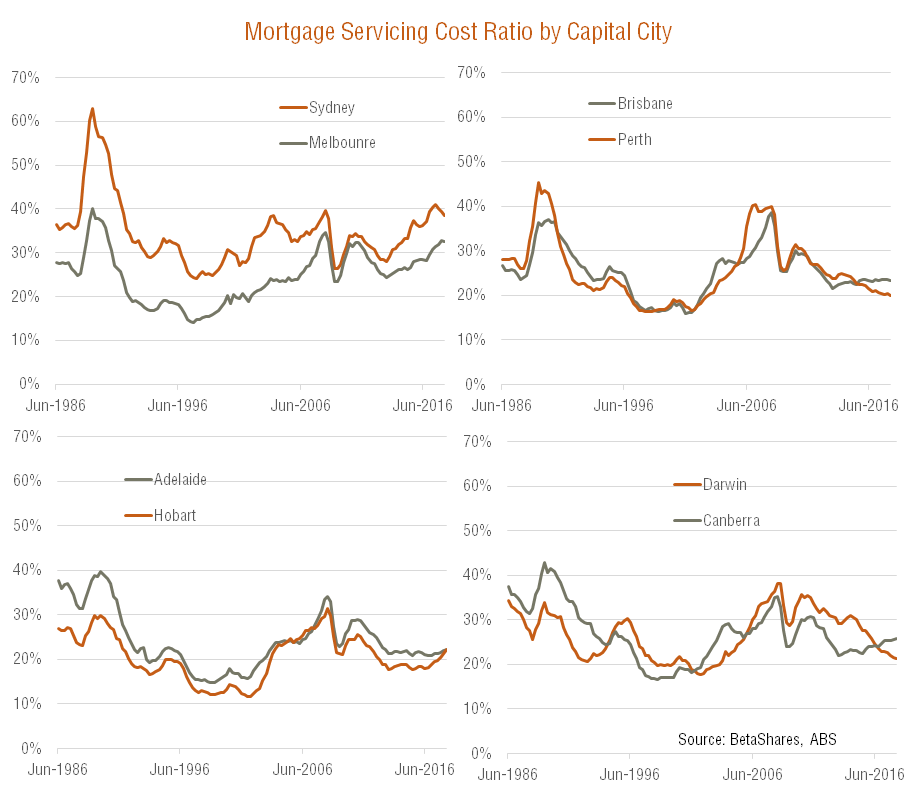
The charts below detail mortgage servicing costs by capital city. As evident, apart from Sydney and Melbourne, most capital cities have mortgage servicing costs at below average levels, suggesting the decline in interest rates in recent years has not had the same effect in boosting prices. For the more mining exposed cities of Perth, Darwin and Brisbane, this is easily explained by the boom then bust in mining related activity. Adelaide and Hobart, by contrast, have suffered with relatively weak underlying economic activity – although at least in the latter city, affordability and lifestyle considerations have more recently fuelled a lift in population growth and house prices.
These measures also suggest Brisbane and Perth now appear relatively cheap compared to valuations in Sydney and Melbourne.
All up, nationwide house prices are certainly high relative to household incomes, largely reflecting the decline in interest rates in recent years. That said, trends across capital cities have been quite disparate. Given the likelihood that interest rates will eventually rise, it still seems likely that house prices will under perform household income for some time – especially in the most expensive cities of Sydney and Melbourne.
In turn, this helps explains the Reserve Bank’s reluctance to cut rates even further to stoke stronger growth and inflation, as while lower rates would have an uncertain effect on wages, history suggests it would almost certainly stoke further gains in house prices – from already over stretched levels.
For those with interest, here’s an interview I did on CNBC yesterday discussing the house price outlook.
*Affordability Measures Explained
Median national established house price in the March quarter is estimated at $690,000. This is based on a population weighted average of national city median (unstratified) established house prices in the Australian Bureau of Statistics (ABS) in its quarterly Residential Property Price Index publication. Historic median house prices for each capital (and the national average) are then generated by applying the established house price series for each capital city. Household income is estimated as after-tax income in each State for a male and female both working full time and earning average full-time ordinary earnings as estimated by the ABS. Based on RBA research, a 10% premium is added to income for allow for higher capital city incomes relative to State-wide averages. Our calculations suggest national after-tax capital city household income in the March quarter on this basis was $135,200. The mortgage interest rate is the average discounted bank variable mortgage interest rate as calculated by the Reserve Bank of Australia, which was estimated at 4.5% in the March quarter. It is assumed households take a 25 year loan for 80% of the value of the home (i.e they have a 20% housing deposits – which increasingly is a big ask, especially in Sydney!).


