The Australian dollar has traded a wide up-trending range against the $US since early 2016, though appears to have broken below this range more recently. This note provides an updated valuation framework to explain recent $A behavior. The model also suggests that, under reasonable assumptions, the $A could test US71c by year-end.
$A – breaking its range
As seen in the chart below, the Australian dollar has tended to push higher since early 2016, touching just over US80c in January this year. Since then the $A has tended to decline, and recently broke below trend-line support around US76c, and is now down to around US74c. What caused this decline, and will it continue?
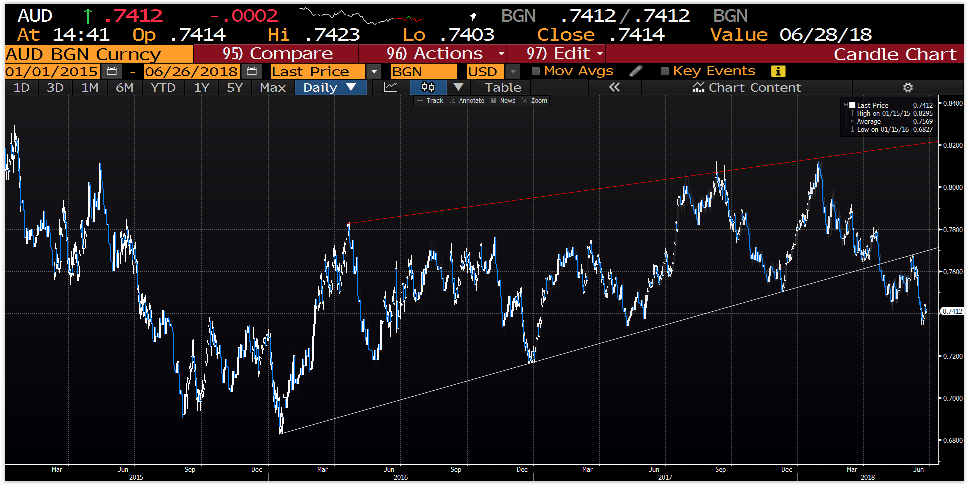 Source: Bloomberg. Past performance is not an indicator of future performance.
A Three-Factor $A Valuation Model
Outlined below are what I consider the three most important drivers of $A behaviour (at least against the $US) over time:

- Relative interest-rate differentials between Australia and the US. When interest rates are rising locally relative to those in the US, it makes Australia a more attractive place to invest for yield-seeking investors, which tends to push up the $A, and vice versa.
- Export commodity prices, proxied by the $US spot price for iron-ore. When export prices are rising it tends to improve Australia’s trade balance and sentiment toward resource stocks and the Australian economy, which in turn are $A supportive.
- The US Index. When the $US is generally rising in global markets, the $A tends to weaken against it along with other currencies.
As seen in the charts below, a statistical model using these factors can explain the $A’s performance relatively well over recent years. In the main, the $A has weakened since 2011 because commodity prices have fallen, interest rate differentials have narrowed, and the $US has strengthened.
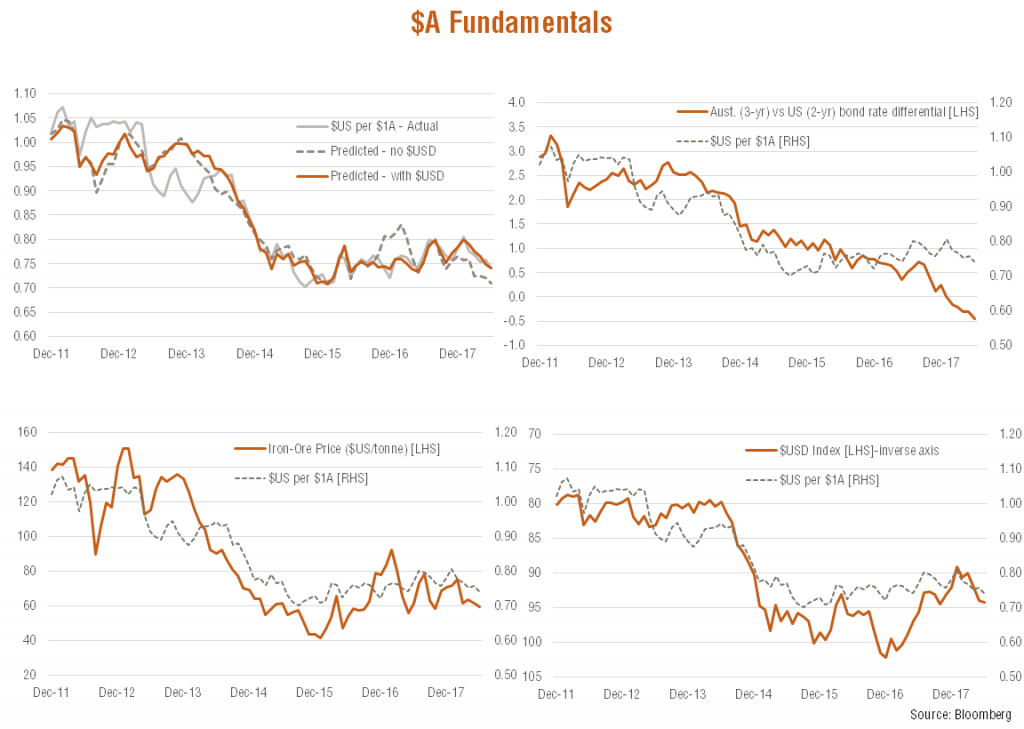
Note, moreover, that the $US itself tends to be an important explanatory factor in its own right, and has tended to produce a model with a better fit to actual $A behaviour than if interest rates and commodity prices were considered alone. The spike higher in iron-ore prices in February this year, for example, did not produce a stronger $A response because it was a time when the $US was also strong. Similarly, the $A is not as weak at present as commodity prices and interest rates would alone suggest, because the $US in recent months has also tended to weaken.
This model also helps explain why the $A held up reasonably well over 2017 despite declining interest rate differentials – as iron-ore prices remained generally firm and the $US tended to weaken.
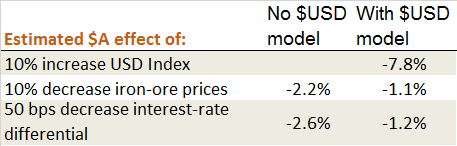
The table below details some estimated $A sensitivities to these factors, using two models – one which excludes and the other which includes the $US. As evident, including the $US in the model tends to reduce the sensitivity of the $A to commodity prices and interest rates, though these factors still tend to have a statistically significant impact on the currency. The three-factor model (i.e. including the $US) suggests a 10% change in iron-prices affects the $A by around 1.2% (or US 0.9 cents at current levels), while a 10% change in iron-ore prices affects the $A by 1.1%. At the same time, a 10% change in the $US Index affects the $A by 7.8%.
 Source: BetaShares
Where to from here?
So far so good, but what does this model imply about future $A behaviour? Of course, no matter how well-fitting a statistical model, its ability to provide future forecasts is only as good as the assumptions made for the future behaviour of the explanatory factors. On the view that the US interest rate differentials narrow a further 0.25% over coming months (reflecting expectations for further Fed tightening) and that iron-ore prices ease back to around $US50/tonne, the model suggests the $A would fall to around US72.20c, even if the $US held steady.
Note the US Federal Reserve only recently signalled it could raise official rates a further 0.5% this year, while the Reserve Bank of Australia has continued to signal a steady policy outlook for some time. Meanwhile, iron-ore prices have also tended to break down somewhat in recent months, suggesting the broad uptrend since late-2015 could be starting to unwind as China attempts to (once again) tackle imbalances in its economy.
What’s more, if the $US Index were to strengthen another 2% back to its level of mid-2017 (around 96), it would suggest a fall in the $A to around US71.10c. Assuming current global trade tensions simmer down, further strength in the $US seems likely given the relative ongoing strength in the US economy and the outlook for rising interest rates compared to other economies such as Japan and Europe.


