On Friday, the Australian dollar declined against the greenback, which resulted in a decline to important support levels. Will they withstand the selling pressure in the coming week?
EUR/USD
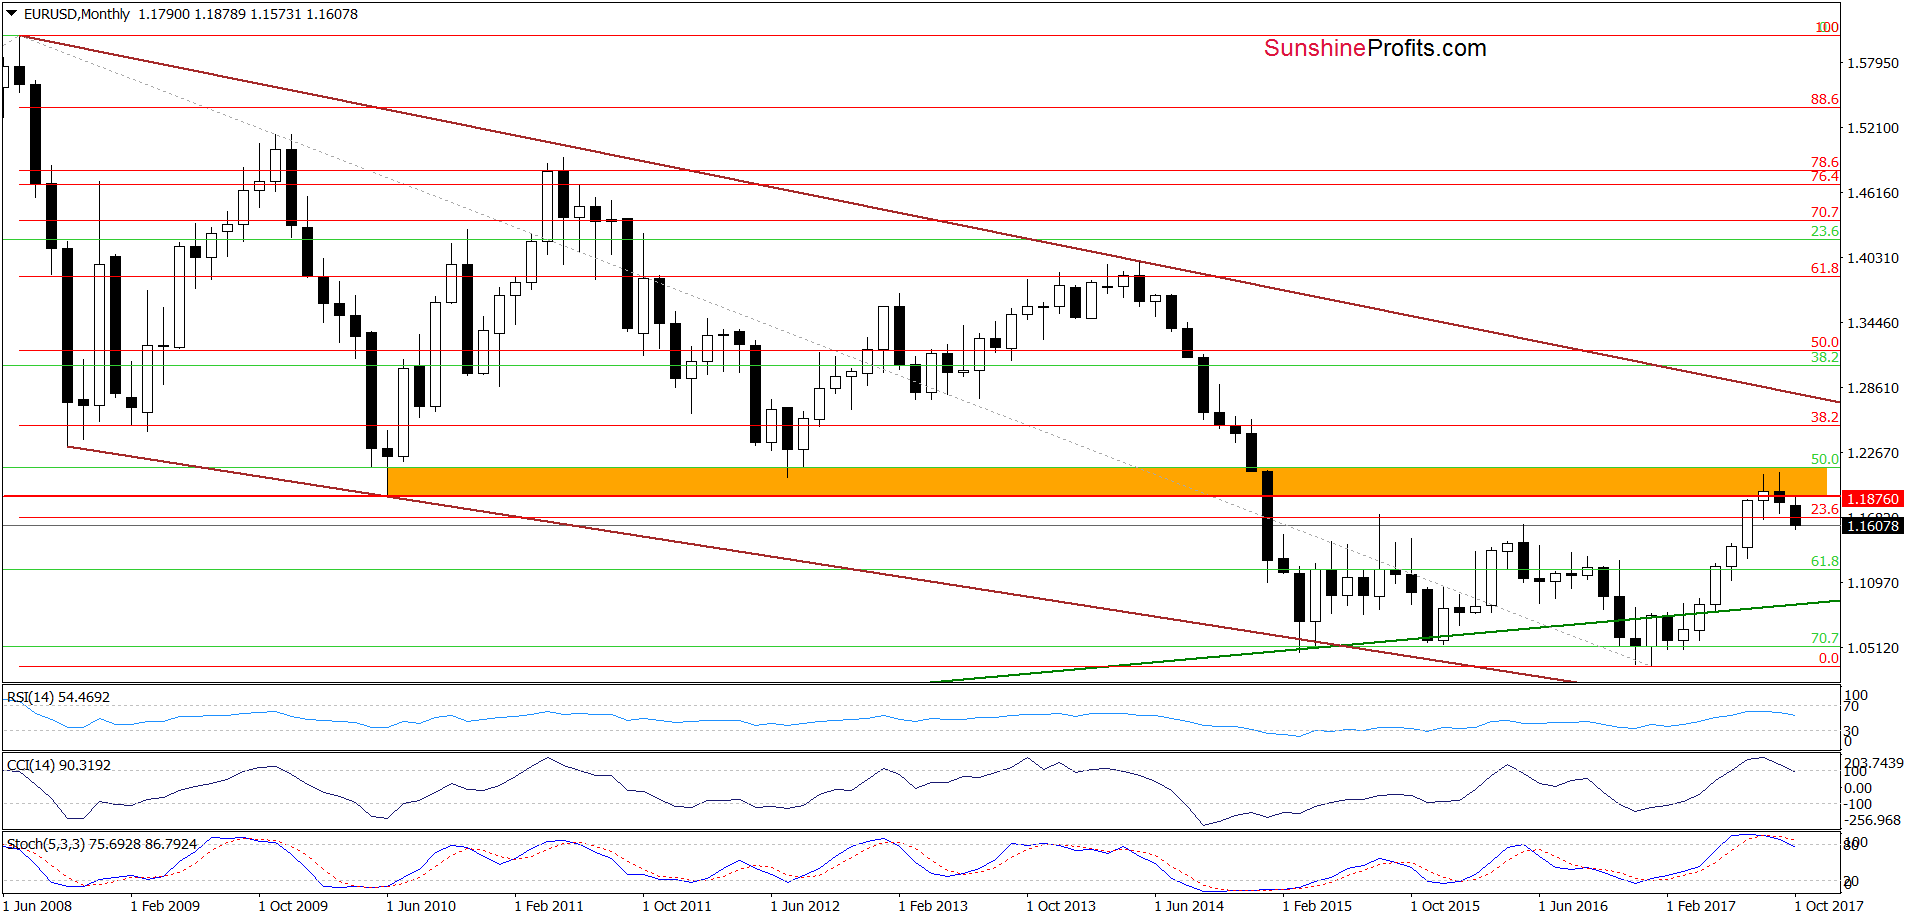

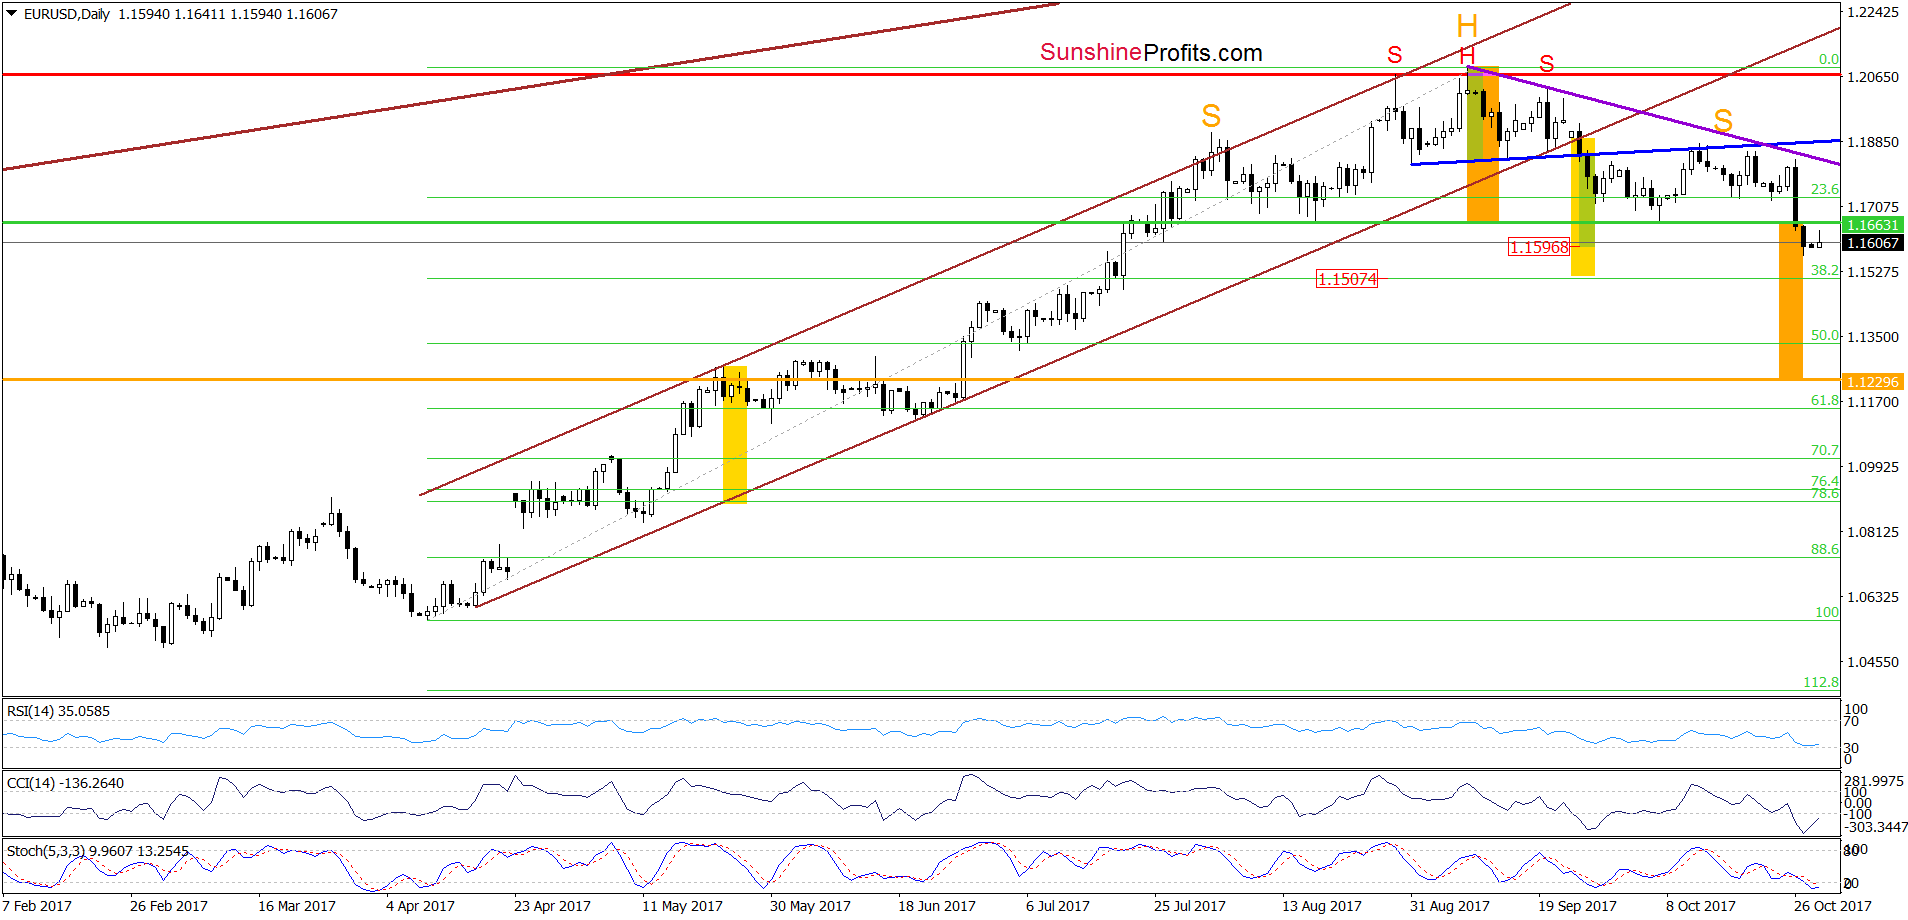
Earlier today, EUR/USD increased a bit, but despite this move, the pair remains under the green horizontal line based on the mid-August and early October lows. Therefore, it seems that today’s upswing is only an attempt to verify the Friday breakdown below this line. If this is the case, the exchange rate will extend losses and we’ll see a realization of the bearish scenario from our Forex Trading alert posted on September 25:
(…) we clearly see a potential head and shoulders formation. Therefore, if EUR/USD declines under the neck line of the pattern (the blue support line based on the previous lows), we’ll see a downward move to around 1.1596, where the size of the move will correspond to the height of the formation.
However, when we take into account a drop under the lower border of the brown rising trend channel and the broader picture of EUR/USD, we think that currency bears push the exchange rate even lower – to around 1.1508, where the size of declines will be equal to the height of trend channel.
Before we move to the next currency pair, please note what we wrote on Friday:
(…) EUR/USD declined under the green horizontal support line, which is also the neck line of a bigger head and shoulders pattern (we marked it with orange). Therefore, if the exchange rate extends losses, we may see not only the realization of the above-mentioned scenario, but also a decline to around 1.1230, where the size of the downward move will correspond to the height of this pattern. As always, we’ll keep you – our subscribers – informed should anything change.
Very short-term outlook: bearish
Short-term outlook: mixed with bearish bias
MT outlook: mixed
LT outlook: mixed
USD/CHF
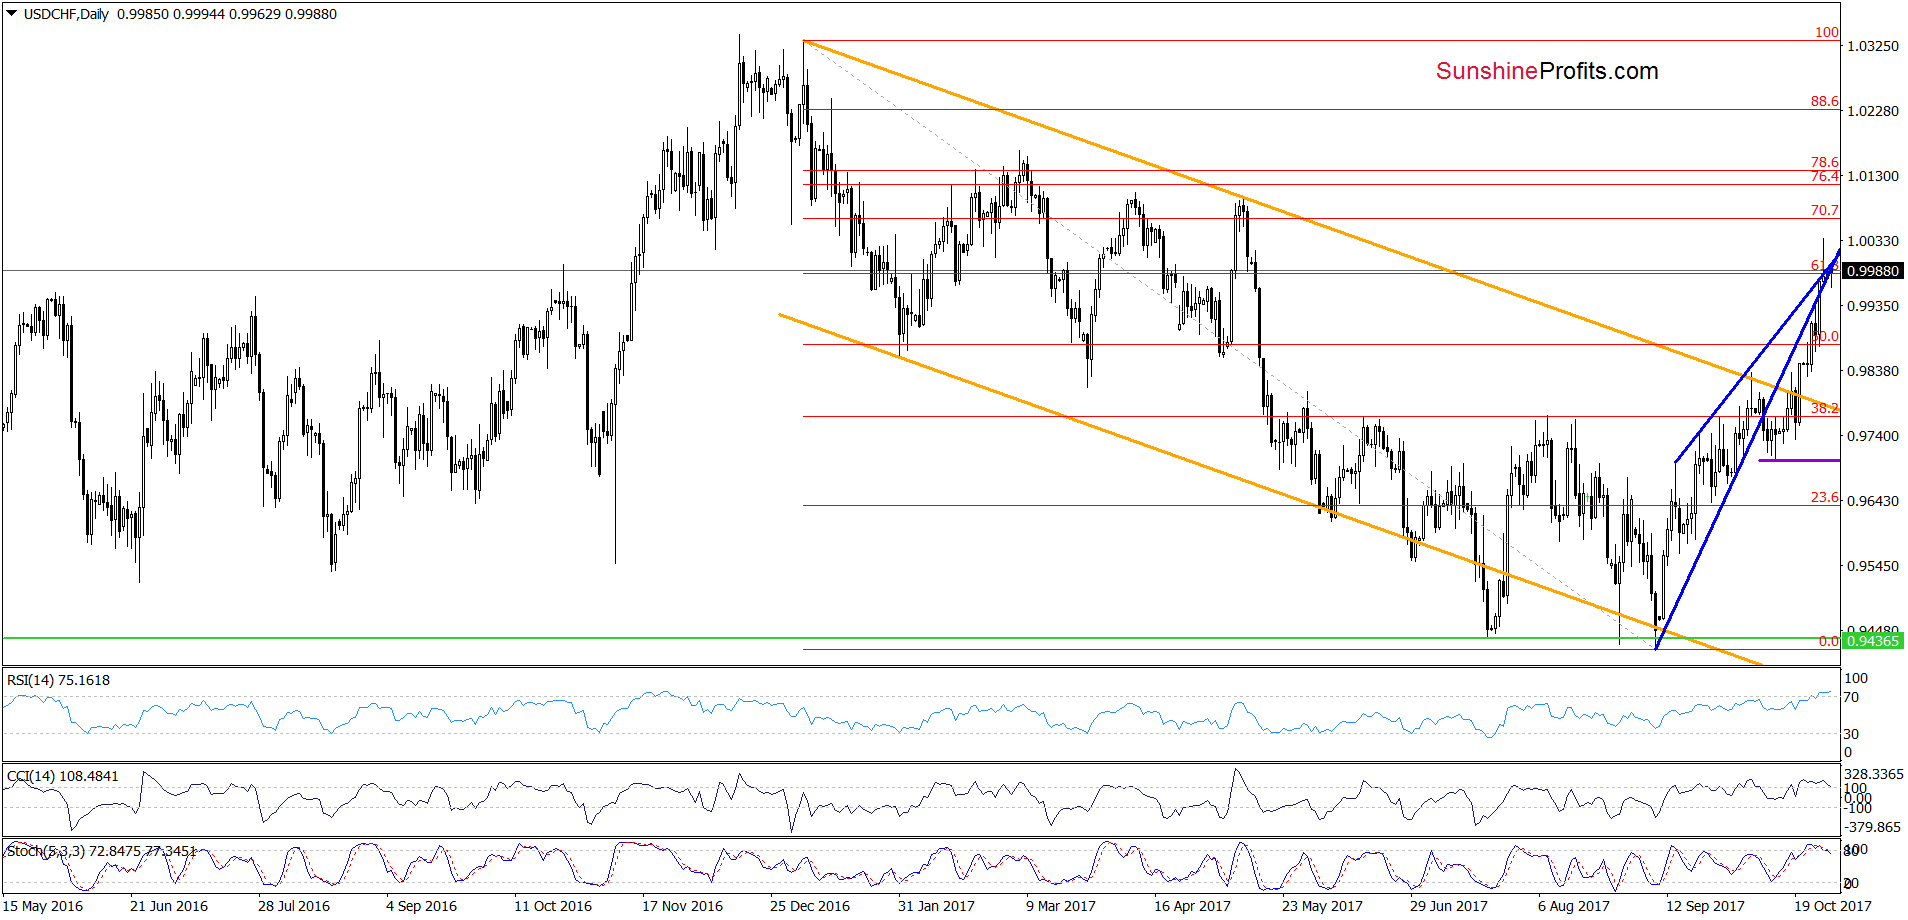
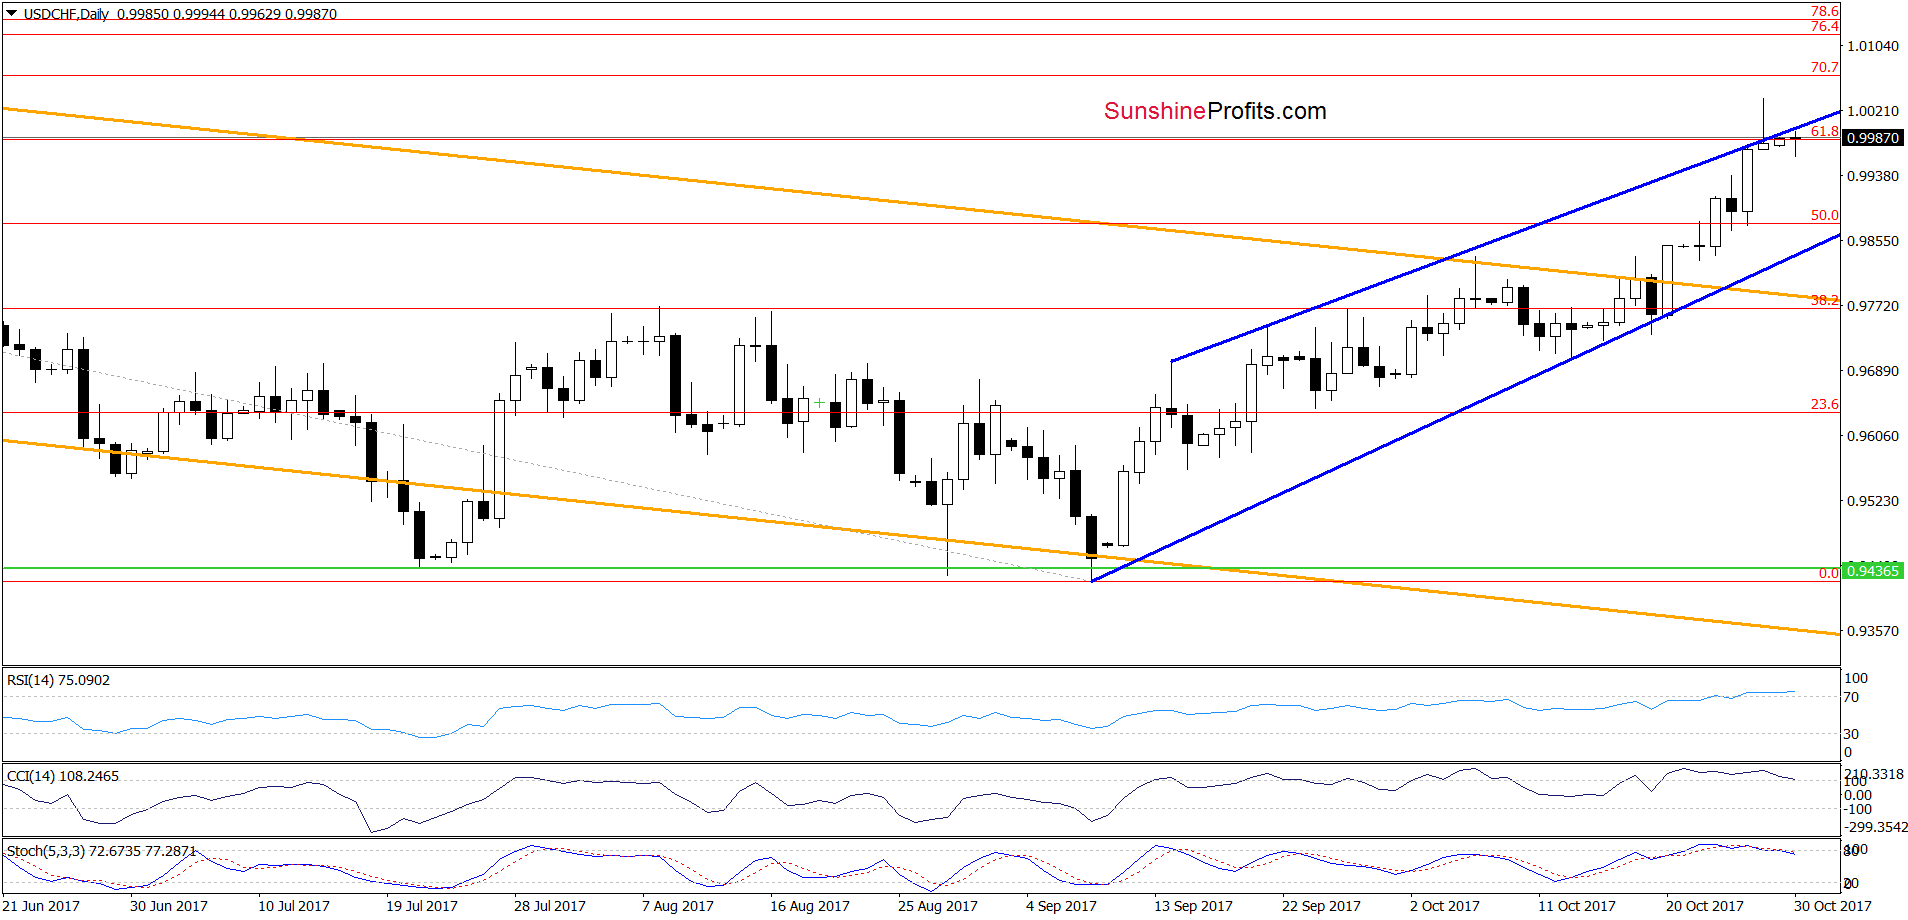
Looking at the daily chart, we see that currency bulls pushed USD/CHF higher once again, which resulted in an increase to the 61.8% Fibonacci retracement and the upper border of the blue rising wedge, which together could pause or even stop further improvement in the coming days. Additionally, the position of the indicators suggests that reversal is just around the corner. Therefore, if we see a decline from current levels, currency bears will likely test the lower border of the formation in the following days.
Very short-term outlook: mixed
Short-term outlook: mixed with bearish bias
MT outlook: mixed
LT outlook: mixed
AUD/USD
Quoting our last commentary on this currency pair:
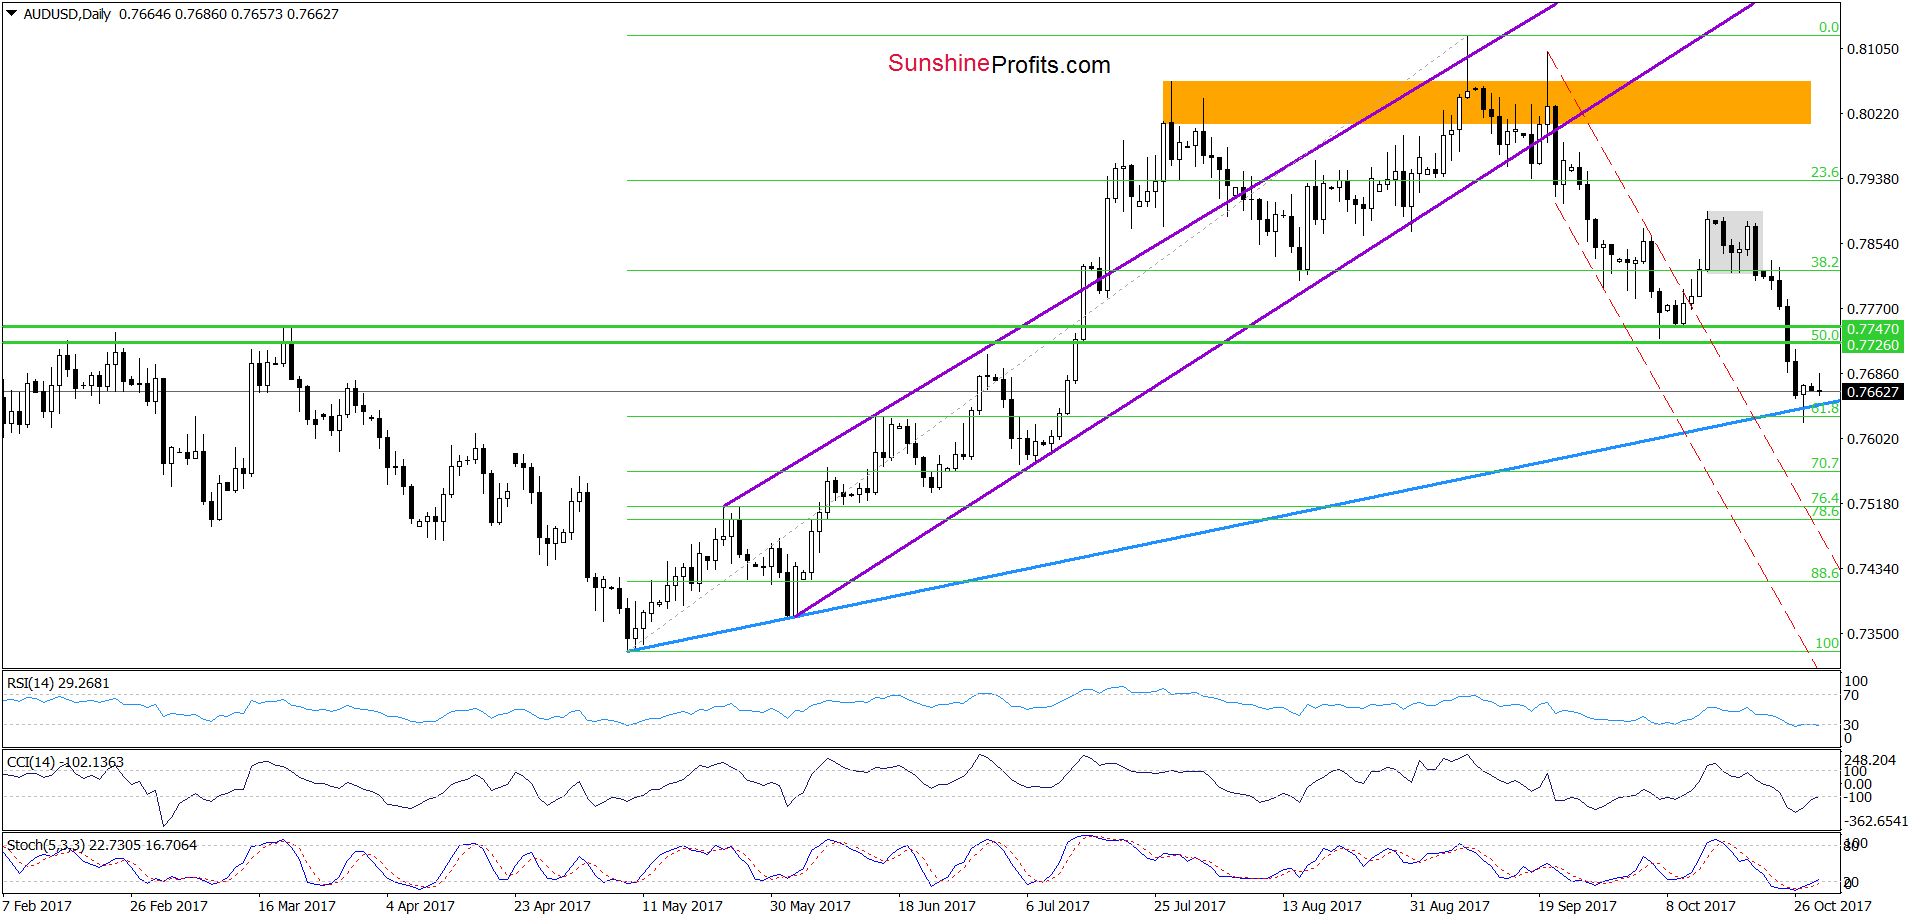
(…) Taking (…) into account (…) the lack of buy signals, which could encourage currency bulls to act, we think that the exchange rate will test the blue rising support line and the 61.8% Fibonacci retracement in the near future.
Looking at the daily chart, we see that the situation developed in line with our assumptions and AUD/USD slipped to our downside target on Friday. What’s next?
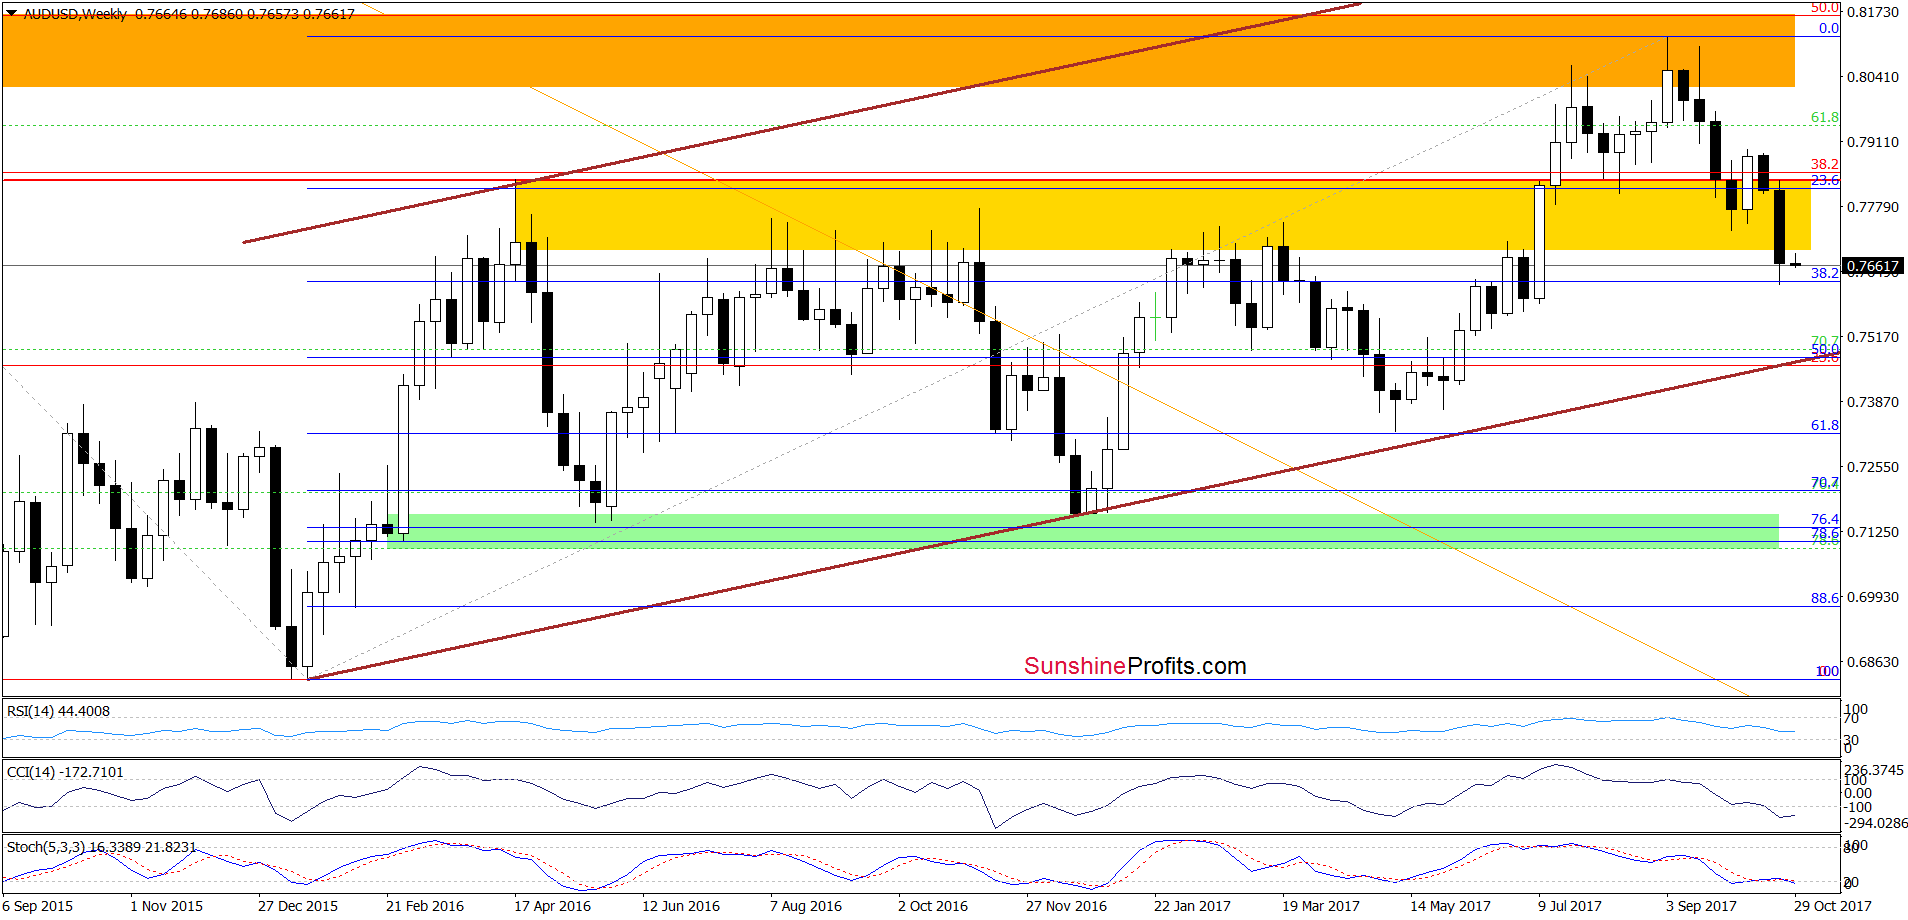
On the weekly chart, we see that the last week decline took the exchange rate to the 38.2% Fibonacci retracement based on the entire 2017 upward move, which will likely trigger a rebound in the coming week – especially when we factor in the proximity to the blue rising support line and the 61.8% Fibonacci retracement, which together stopped bears in the previous week. The pro bullish scenario is also reinforced by the current positions of the daily indicators (the Stochastic Oscillator generated buy signals, while the RSI and the CCI are very close to doing the same).
How high could the pair go? In our opinion, the first upside target for currency bulls will be around 0.7726-0.7747, where the previously-broken green horizontal lines are.
Very short-term outlook: mixed with bullish bias
Short-term outlook: mixed with bullish bias
MT outlook: mixed
LT outlook: mixed
Naturally, the above could change in the coming days and we’ll keep our subscribers informed, but that’s what appears likely based on the data that we have right now. If you enjoyed reading our analysis, we encourage you to subscribe to our daily Forex Trading Alerts.
Thank you.
Nadia Simmons
Forex & Oil Trading Strategist
Przemyslaw Radomski, CFA
Founder, Editor-in-chief, Gold & Silver Fund Manager
Gold & Silver Trading Alerts
Forex Trading Alerts
Oil Investment Updates
Oil Trading Alerts


