
Two things should be obvious: We are in a totally artificial recovery due only to global printing of $13 trillion and more recently, tax cuts; and this is now the longest rally and economic recovery in U.S. exceeding 10 years.
There has been a recession every 10 years since I was a kid: 1962, 1970, 1973-1975, 1980-1982, 1990-1991, 2001, and most recently 2008-2009.
The sunspot cycle has captured them all and that has averaged a little over 10 years since 1900. That cycle is near a bottom and is not due to turn up until at least late 2020 and more likely 2021 or later.
What the Pundits Believe

As I said yesterday: How long can you keep consumers spending on ultra-low rates until everyone is re-employed who is remotely capable and everyone has refinanced their mortgage or bought a better car or house?
More and more leading indicators are showing slowing here – and around the world even more so.
But then the pundits argue that there is nowhere else for investors to put their money with such artificially low bond yields, and that simply continues until there is a major economic disappointment or the bubble just bursts of its own extremes. Was there a recession when the tech bubble peaked in March 2000? Not until almost a year later. Was there a recession when Japan’s Nikkei bubble peaked at the end of 1989? Their economy looked a lot better than ours today and was not running on endless money printing yet.
But History Shows…
I have showed a plethora of charts that almost all say that stocks are the most overvalued in history, more than in 1929 and every other major top, except the tech bubble that peaked in March 2000. But that saw the greatest fundamental trends converge in history that almost no one but me saw coming in the 1980s. You can’t even remotely compare economic statistics in this recovery to that unprecedented boom. The total market cap to GDP ratio is at the highest ever, above the 2000 top, as is price to sales, which is not as manipulable as profits.
Here’s another simple one from Ned Davis, one of the few good cycle guys on Wall Street.
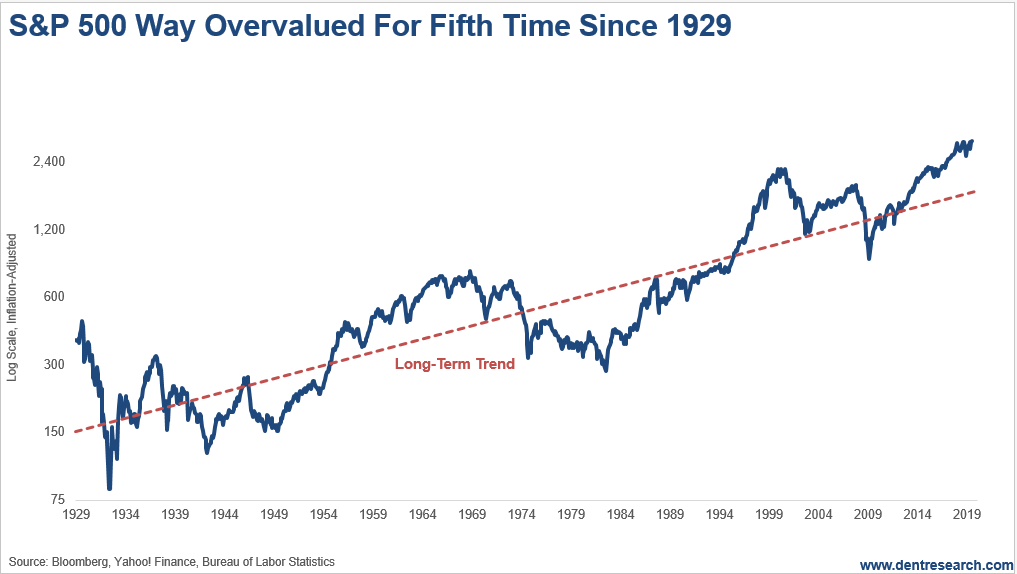
This chart of the S&P 500 against its long-term trend line since the early 1900s is the first to show greater over-valuation in 1929 than 2000. But one thing is clear: We are in another major over-valuation trend that will correct and a final Dark Window rally likely ahead will only make that more extreme like 2000 and 1929. This chart is similar to the cyclically adjusted P/E ratio from Robert Shiller.
The Most Likely Scenarios
A final blow-off rally to as high as Dow 33,000 and Nasdaq 10,000 would still be the best peaking scenario with even higher overvaluation. But the megaphone patterns since January 2001 are also suggesting we may have seen the best of that final rally and we see one more rally to slight new highs only on the Nasdaq and not the Dow and S&P 500, after a deeper correction near term.
In the 5 Day Forecast for Boom & Bust subscribers two weeks ago, I showed the two most likely scenarios for this final top, and like the leading indicators on Tuesday, they point towards January to March of 2020. After reviewing Andy Pancholi’s latest cycles at The Market Timing Report, I would stretch that final top in the Nasdaq only to as late as early May.
This market is overvalued enough to blow any time something big enough goes wrong… or like in Japan in 1989 and the tech bubble in early 2000, even if something doesn’t.
Follow Me on Twitter @HarryDentjr.
___
Equities Contributor: Harry Dent
Source: Equities News


